JDash – JTrack Dashboard
JDash is a Django-based web platform for managing digital health studies conducted through JTrack mobile applications. This provides a unified interface to design, monitor, and manage behavioral and sensor-based research studies initiated by clinical institutions and the Biomarker Development Group. The system connects mobile app data with researcher-controlled dashboards. The main goal is to simplify the lifecycle of digital studies — from study setup and survey design to subject enrollment, progress monitoring, and data quality.
System Architecture
JDash follows a modular Django-based architecture with a Bootstrap-powered frontend and embedded Plotly-Dash dashboards for visualizing participant compliance, sensor activity, and study progress.
Core Components
Backend: Django-based application handling authentication, routing, form processing, database operations, and server-side rendering.
Frontend: HTML templates styled with Bootstrap, using BootstrapTables and AJAX for interactive tables, filtering, file uploads, and dynamic UI updates.
Database: MariaDB stores studies, subjects, sensor settings, EMA surveys, tasks, audit checks, notifications, and user-related configuration.
Visualization Components: Interactive compliance visualizations are implemented using Dash and Plotly components integrated within Django views and templates.
Deployment: Supports local development with Django
runserverand production deployment using Apache withmod_wsgi.
Login
Provides authentication for registered users such as investigators and administrators. Users log in with a username and password. A default demo user (demouser) is available for testing.
Quick access:

Login Form
Visit https://jdash.inm7.de
Enter your personal credentials into the login fields and press “Login”.
You can find your login credentials inside a PDF-file that was sent to you via email.
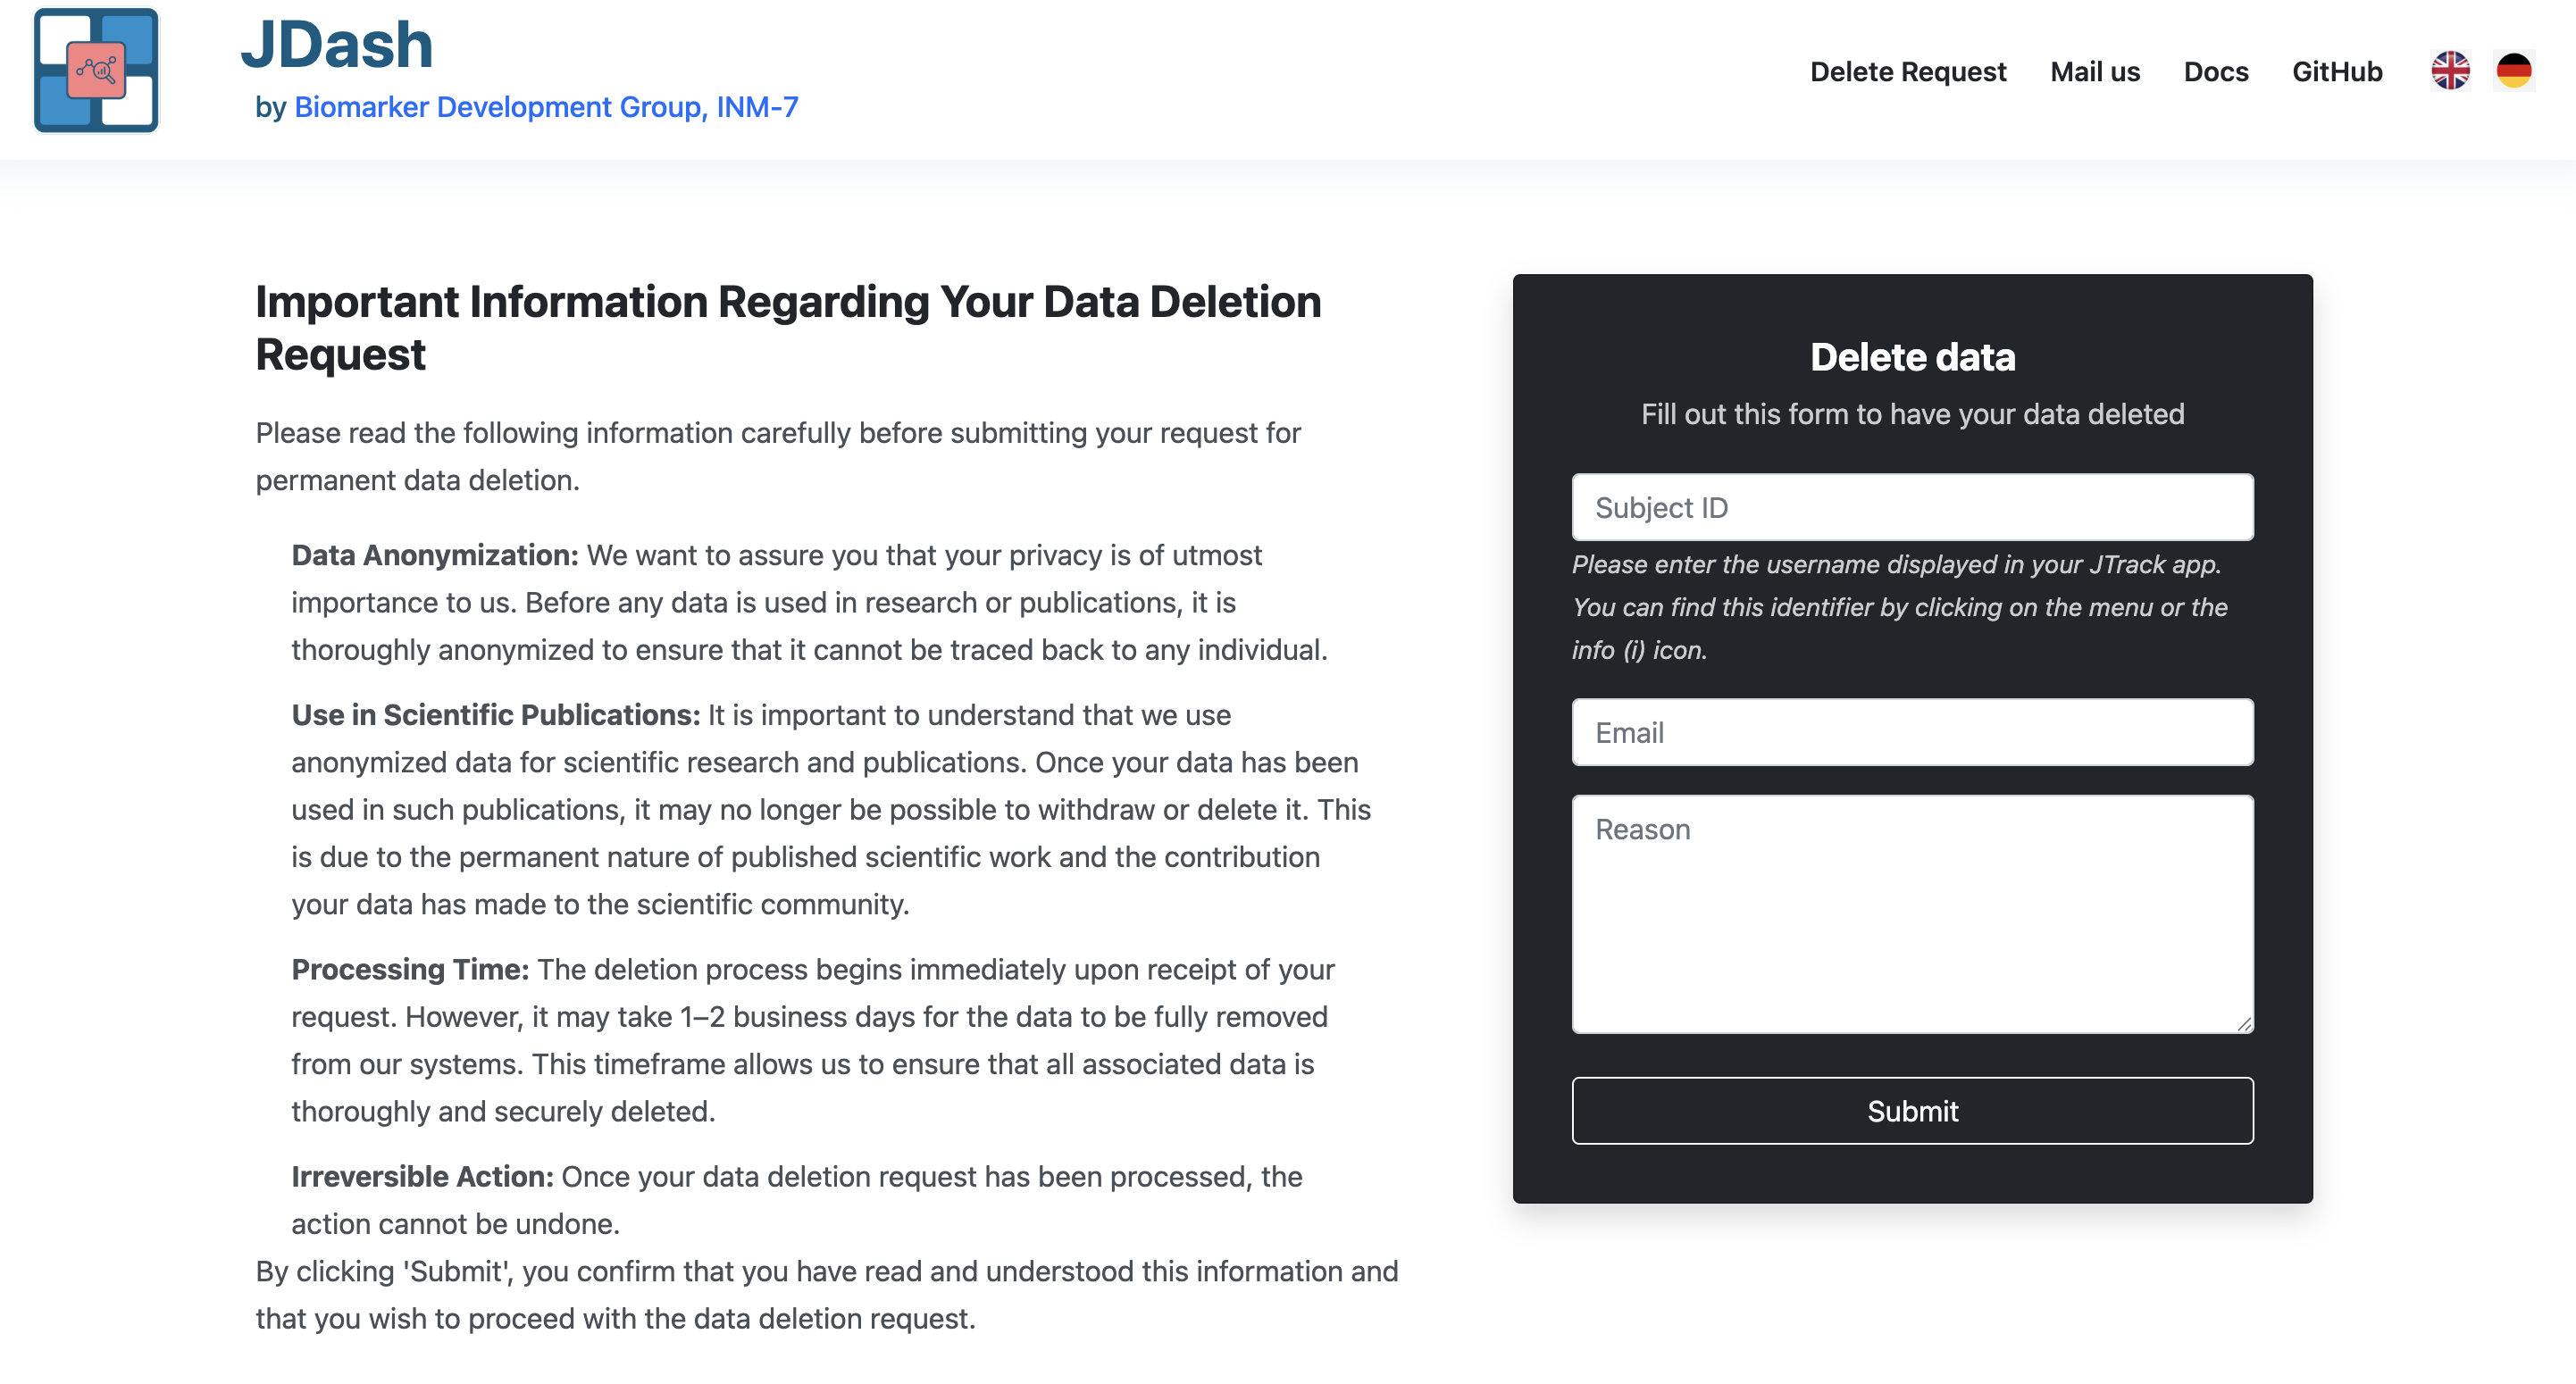
Data Deletion Form
The page allows participants to request permanent removal of their collected data from the JTrack system.
To submit a request, users must provide:
Subject ID — the identifier shown in the JTrack app
Email — for confirmation or follow-up
Reason — an explanation for the deletion request
After submitting the form, the request is forwarded to the study team for manual verification and processing. Data deletion begins once the request is reviewed and approved.
Language Switcher
To change the language of the website please click on the respective flag. Currently only German and English are supported.
Important
The data will be permanently removed and cannot be restored. Please make sure to provide the correct Subject ID.
Direct Contacts
For collaboration enquiries and scientific questions you can contact Dr. Juergen Dukart or Dr. Mehran Turna. For technical questions please contact Jona M. Fischer or Mamaka Narava
Dashboard Tabs
Studies
Central hub for study management, showing all studies the user can access or create. Grid/List Toggle: Allows switching between study card and list layouts. Search Bar: Filters displayed studies.
Interface Overview:

Create New Study
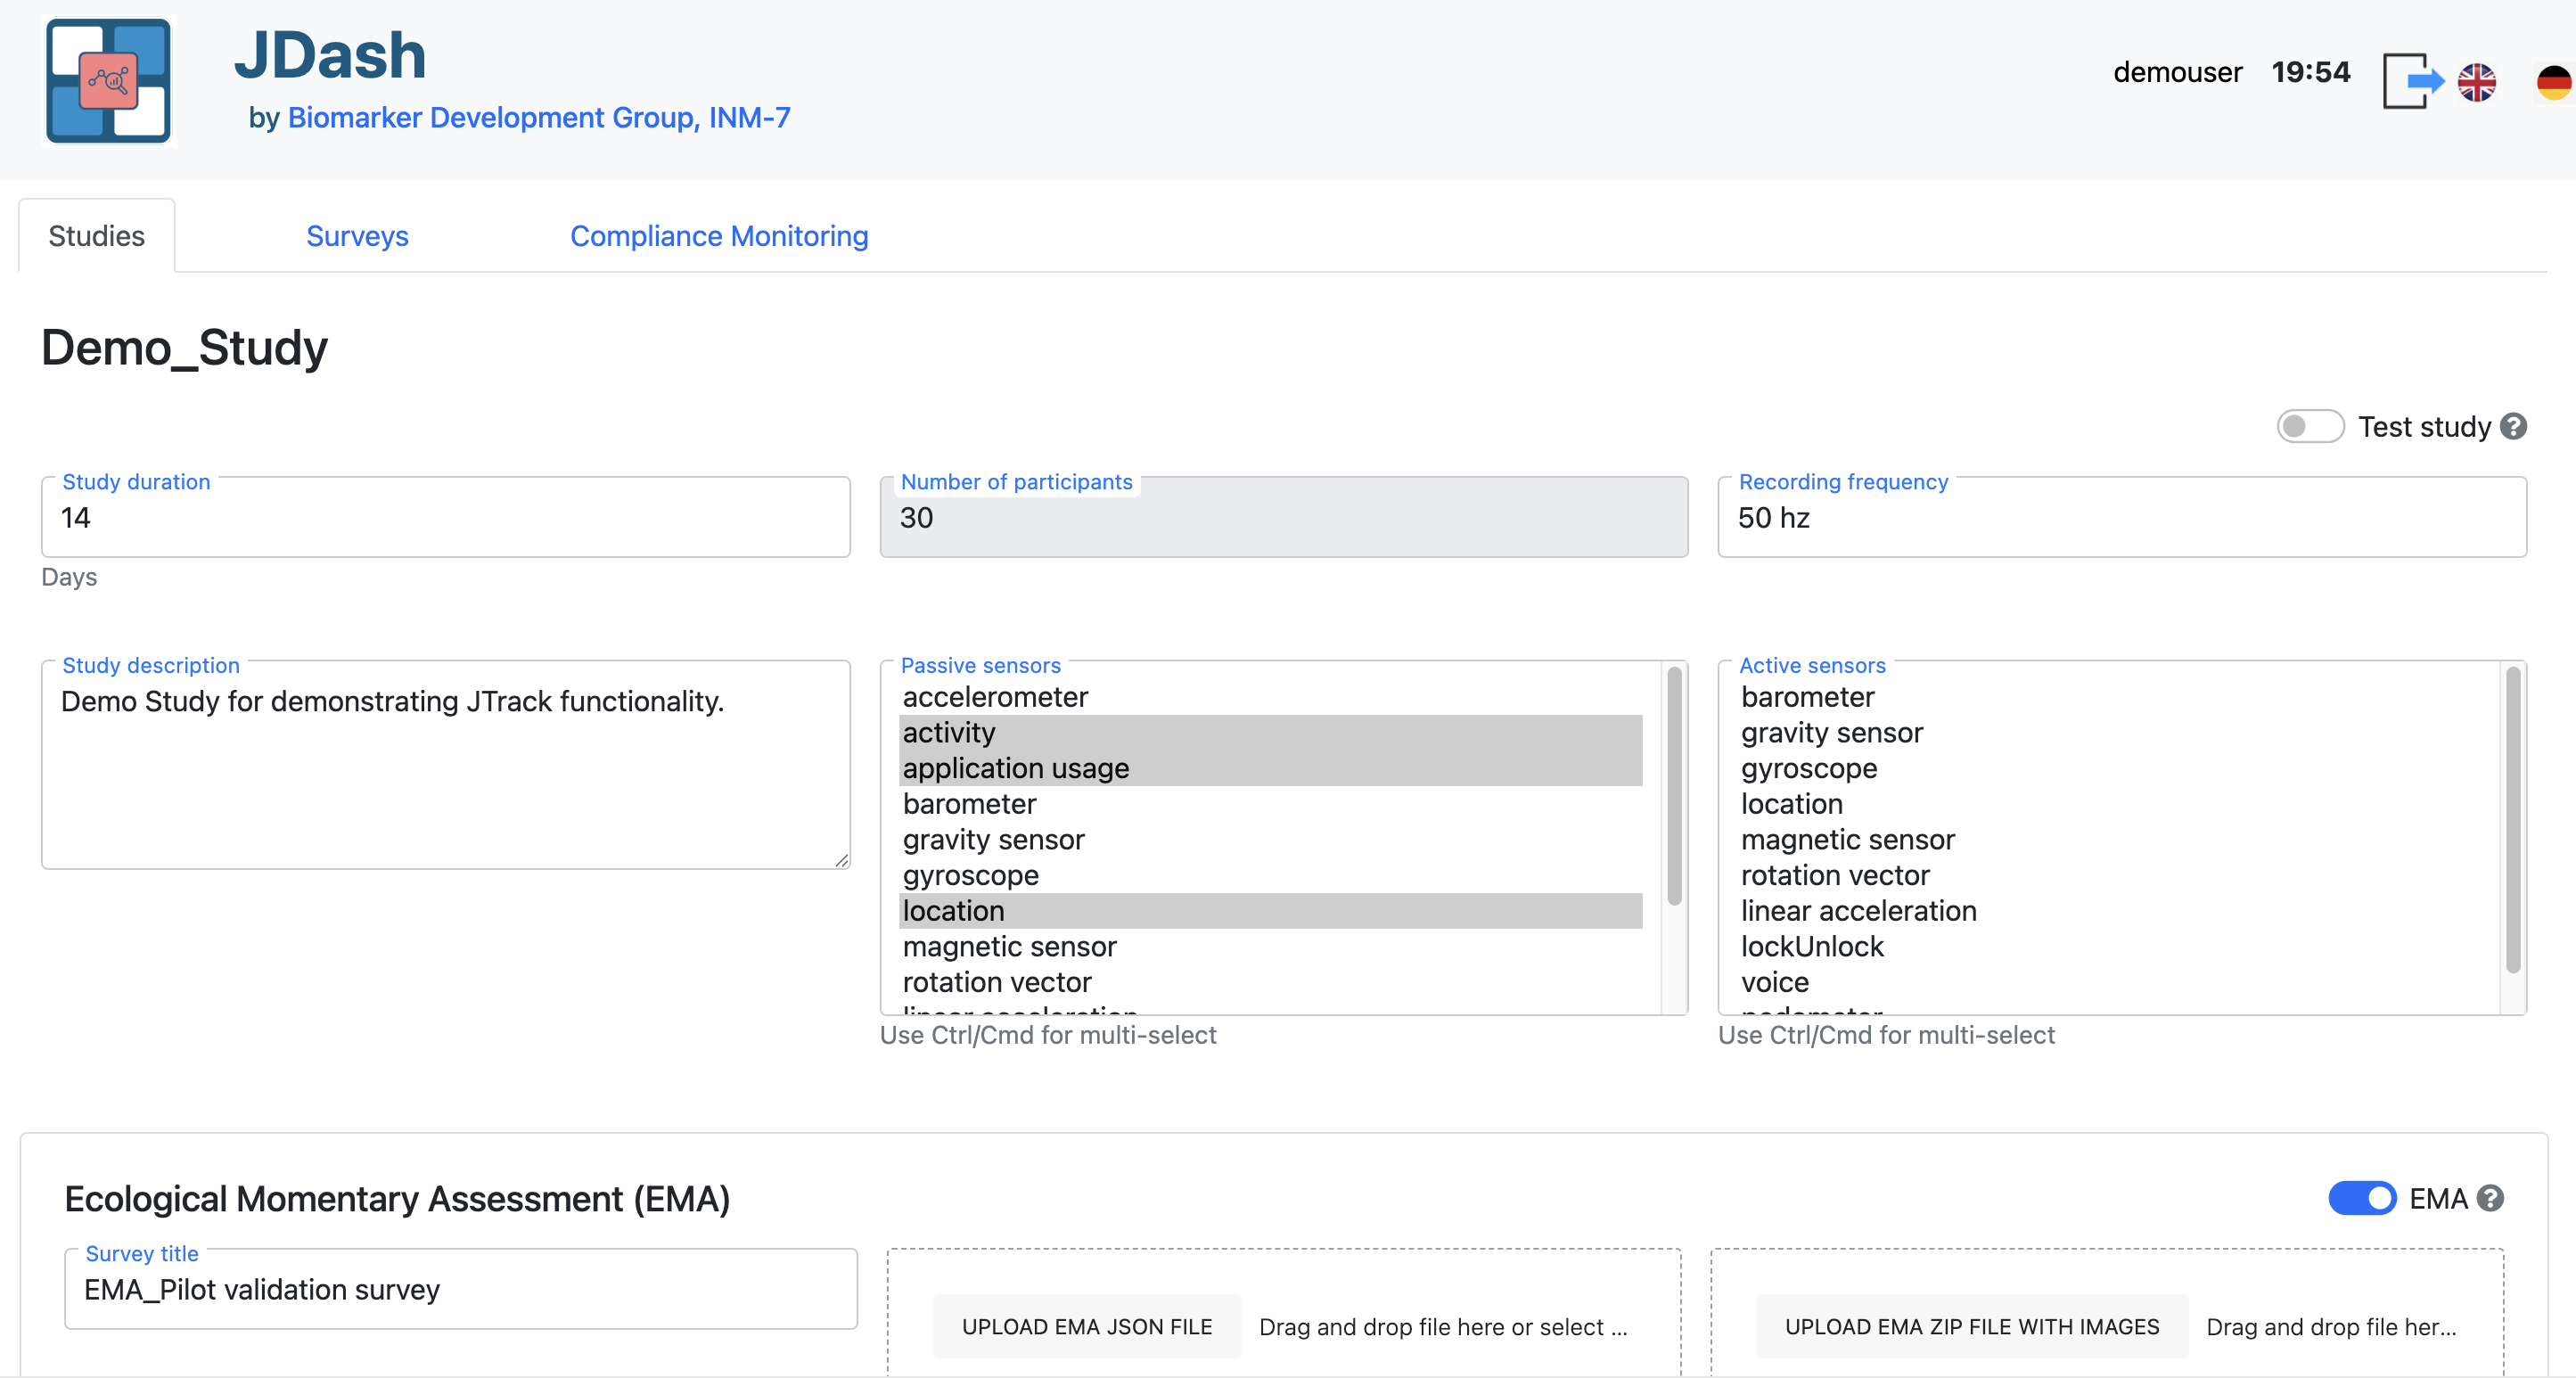
The New Study form is used to configure and start a new data collection project in JDash. Here you define basic metadata, sensor configuration, optional EMA surveys, and experimental tasks.

Form Fields
Study name
Unique identifier for the study.
Do not use spaces or special characters (prefer MyStudy_01 instead of
My Study 01).
Test study
Checkbox indicating whether this is a test/pilot study.
Enabled: data are clearly marked as test data and can be discarded later.
Disabled: study is treated as a regular production study.
Study description
Free-text description of the study purpose, protocol, cohort, or any notes for administrators. This is not shown to participants.
Duration
Length of the study in days. Defines the time window during which study is active for each participant.
Number of subjects
Planned number of participants for this study. Used for planning and monitoring recruitment progress.
Recording frequency
Sampling rate for sensor data collection, expressed in Hertz (Hz). This defines how many measurements are recorded per second.
Note
Higher frequencies provide more detailed sensor data but may increase battery consumption and storage requirements. Choose a value appropriate for your study’s goals and device performance limits.
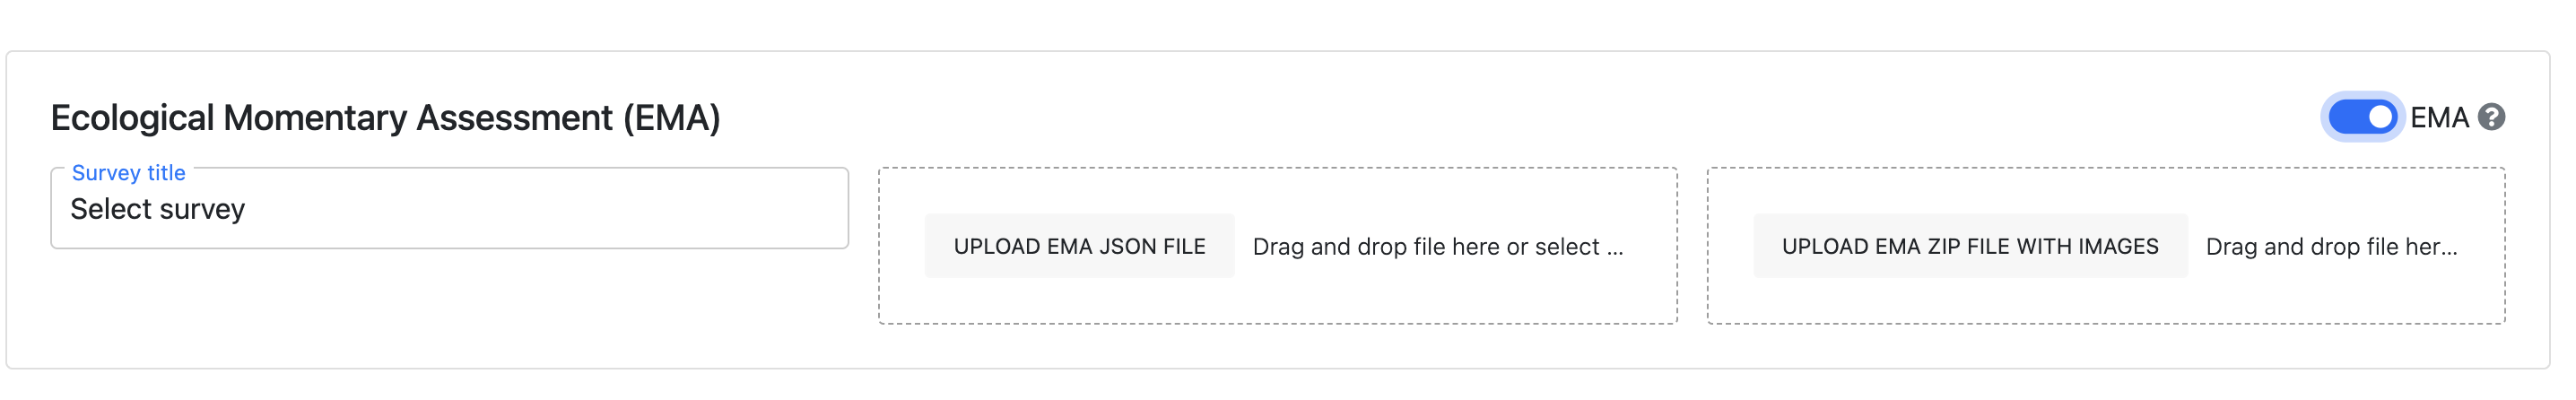
EMA (Ecological Momentary Assessment)
Checkbox to enable or disable EMA for this study.
Enabled: the study is linked to EMA survey.
- Disabled: no EMA questionnaires are used; only sensor data and tasks apply.
- Survey title
Dropdown to select an existing EMA survey that has been defined in the Create Survey section. This determines which questionnaire is delivered to participants.
- OR UPLOAD EMA JSON FILE
Drag-and-drop area or file picker to upload a survey JSON directly for this study. - Can be used instead of selecting an existing survey. - The JSON structure must follow the JDash/JTrack EMA schema.
- UPLOAD EMA IMAGES ZIP FILE
Drag-and-drop area or file picker to upload a ZIP archive containing image assets used in EMA questions (e.g., visual prompts). - Filenames in the ZIP must match the
Image Urlfields used in survey questions.
Sensor configuration
How to configure active labeling
In JDash, study conductors can configure the Active Labeling feature to collect labeled sensor data for specific tasks or activities. This setup is essential when precise associations between sensor signals and user-performed tasks are required.
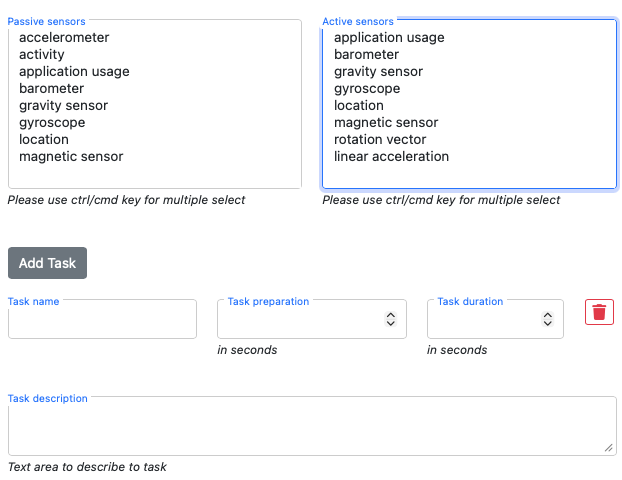
Within the study settings on JDash, you can:
✅ Enable active labeling for your study.
🎯 Select the sensors that should be recorded during active labeling sessions (e.g., accelerometer, gyroscope, microphone, etc.).
📝 Define multiple labeling tasks:
- Each task has a
name (e.g.,
Walking,Brushing Teeth),preparation time (in seconds),
duration (in seconds).
description/instructions optional for participants.
These tasks will appear in the participant’s app as selectable activities during active labeling.
Note
Active labeling will only be enabled if active sensors are selected in the configuration.
Example task list JSON:
[
  {
    "task_name": "Brushing Teeth",
    "task_duration": 30,
    "task_description": "Please simulate brushing your teeth for 30 seconds."
  },
  {
    "task_name": "Walking",
    "task_duration": 60,
    "task_description": "Walk normally in a straight line for one minute."
  }
]
This list is presented to participants inside the JTrack Social app with autocomplete, so tasks are standardized and consistent.
Tip
Use descriptive task names and clear instructions to help participants understand what to do during each session.
Inside of JTrack Social, Active Labeling is then accessible from the Main view (both in iOS and Android).
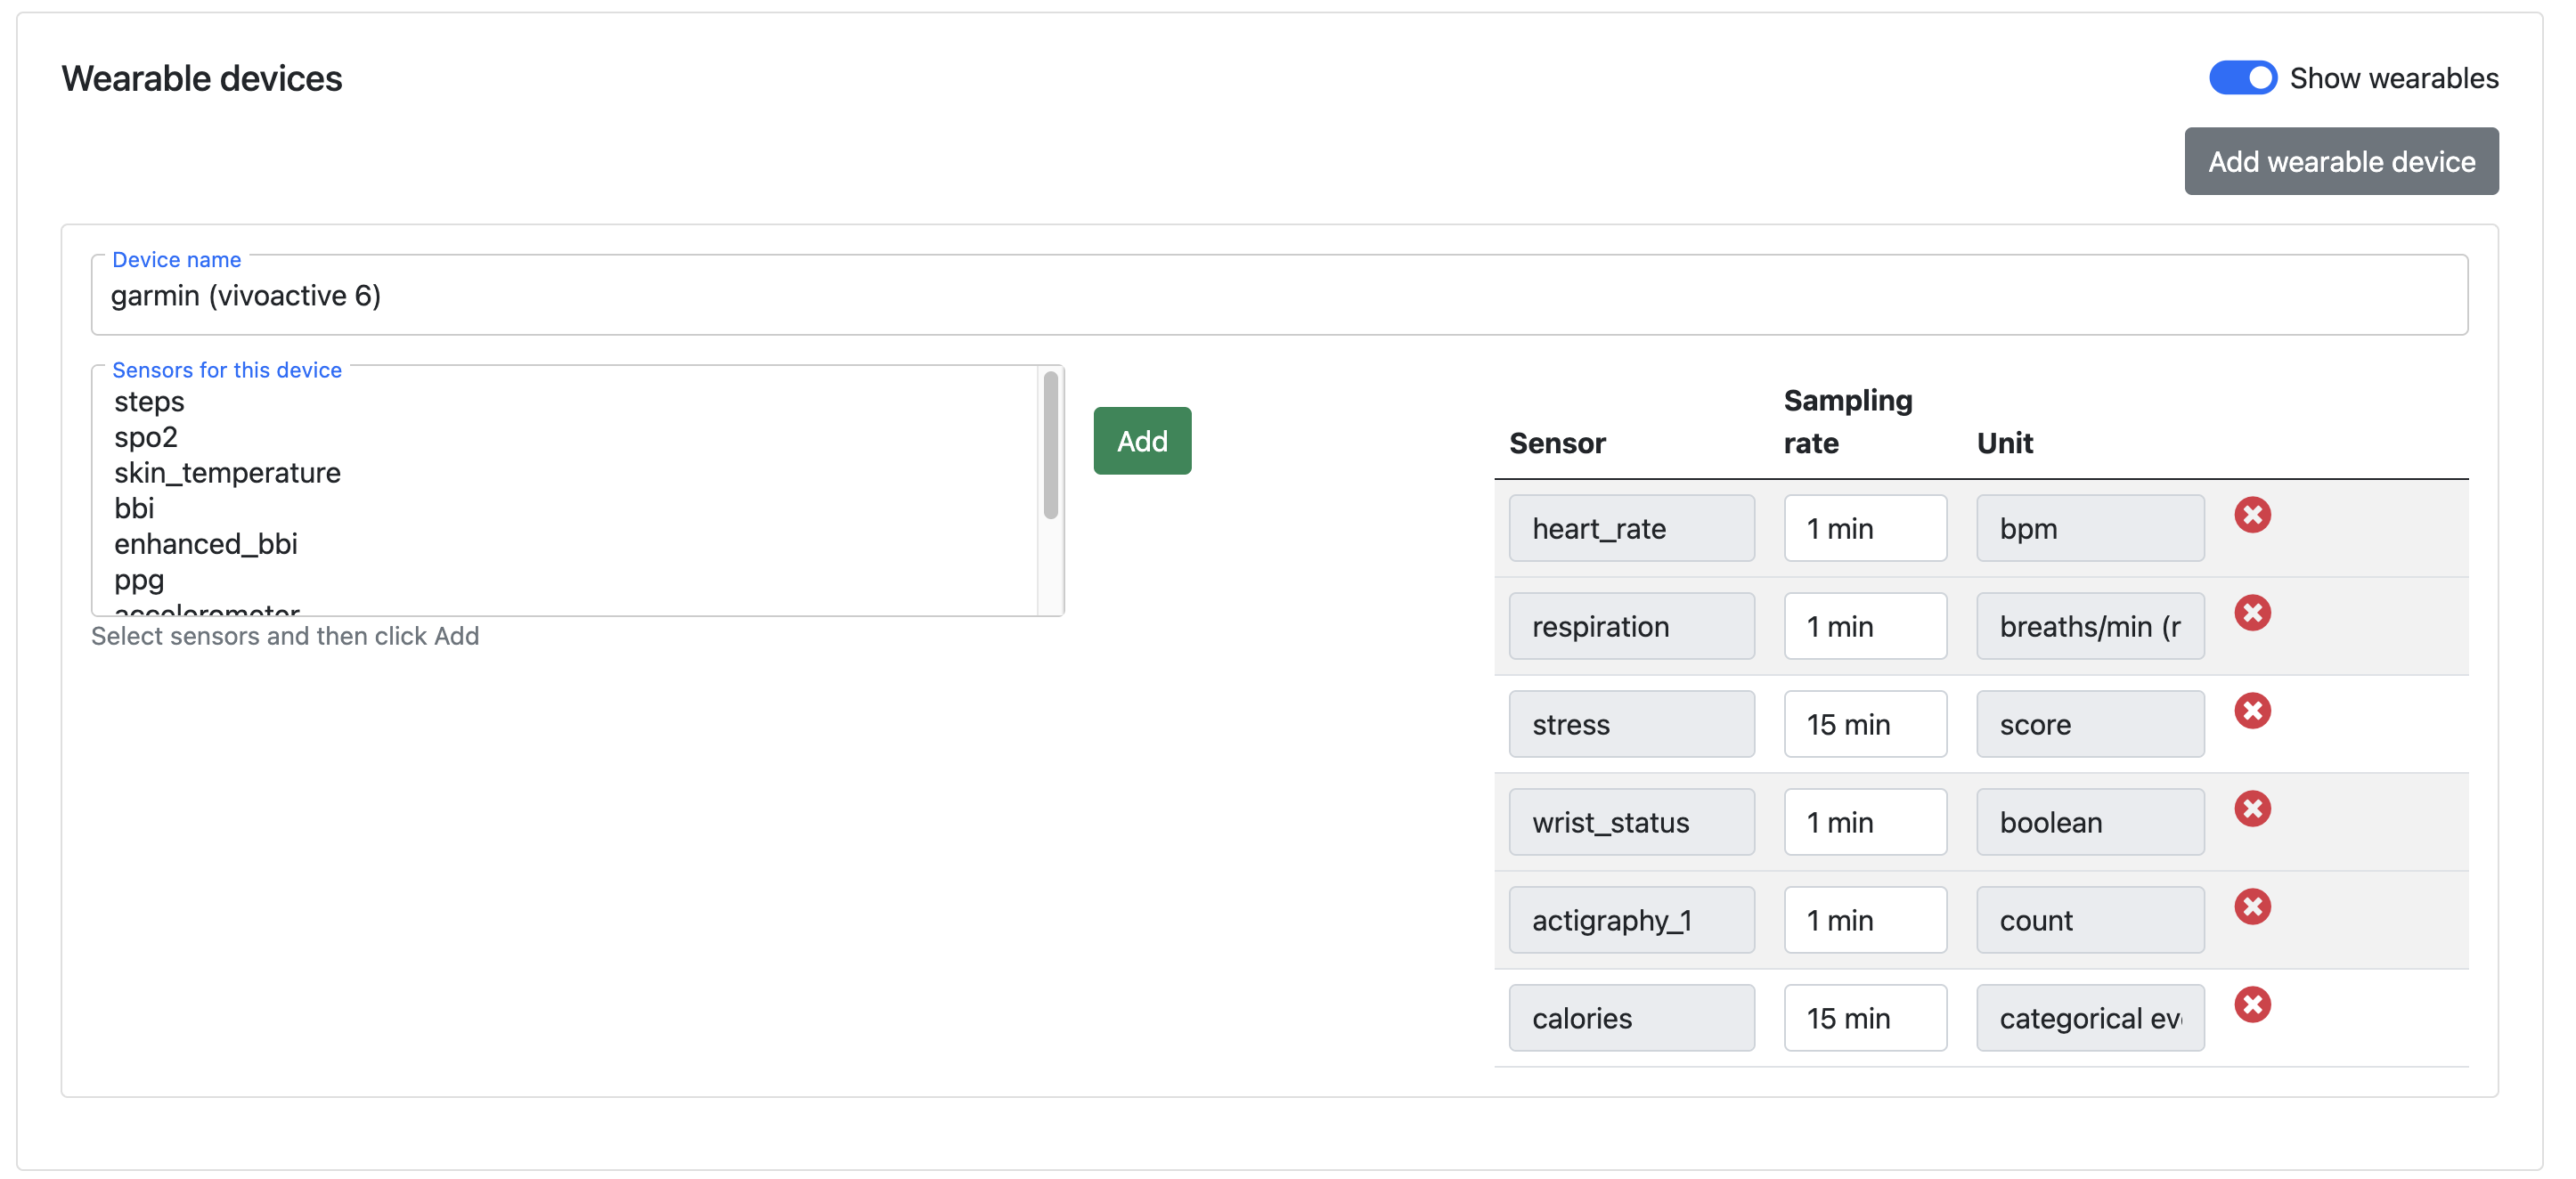
Wearable Devices
This section allows administrators to configure external devices (e.g., smartwatches) and define which sensors should be collected as part of the study.
This feature enables integration of wearable sensor data alongside mobile and EMA data.
Enable Wearables
Show wearables toggle Enables or disables wearable device configuration for the study.
Add wearable device Button to add a new wearable device configuration.
Device Configuration
Each wearable device includes the following:
- Device name
Name of the wearable device (e.g.,
garmin (vivoactive 6)).- Sensors for this device
List of available sensors supported by the device, such as:
steps
spo2
skin_temperature
bbi / enhanced_bbi
ppg
accelerometer
Select one or more sensors and click Add to include them in the study.
Selected Sensors Table
After adding sensors, they appear in the configuration table with the following fields:
Sensor Name of the selected sensor (e.g.,
heart_rate,respiration).Sampling rate Frequency at which data is recorded (e.g.,
1 min,15 min).Unit Measurement unit for the sensor data (e.g.,
bpm,breaths/min,boolean,count).Remove (×) Deletes the sensor from the configuration.
Note
Adding high-frequency wearable sensors may increase data volume and impact storage and processing performance. Choose sensors and sampling rates based on the study objectives.
Study Details
Overview panel
The panel (1) provides a quick snapshot of the study configuration. It summarizes the most relevant study parameters so administrators can review key settings at a glance.

The panel displays:
Duration — total length of the study in days
Sensors — list of passive and active sensors enabled for the study
EMA — indicator showing whether an EMA survey is assigned (with a Survey details button to view the full questionnaire)
This section helps users verify that the study has been configured correctly before adding participants or exporting data.
Toolbar Panel
The toolbar (2) contains shortcut actions for managing study-level operations. These icons are located in the top-right corner of the Study Details page.
The available actions typically include:
Refresh — to update the data and view the current status of subjects/sensors
Export PDF — generates a PDFs of QR codes of participant sheets that have not been used
Download Data — triggers email to downlaod the collected sensor or EMA data
Database Actions — to delete subject data from the study and server (e.g., remove all data associated with the study)
These tools provide quick access to the most common administrative actions, allowing study investigators to monitor progress, retrieve data, and perform maintenance efficiently.
Subject Table
The table (1) displays all subjects associated with the selected study. It provides an overview of each participant’s status, app type, sensor configuration, and study duration.

The table includes the following columns:
Subject ID — the unique identifier assigned to each participant
App — indicates whether the entry belongs to the main app or the EMA app
Duration — number of days the participant has been in the study
Sensor Information — list of sensors enabled for that subject (e.g.,
at= activity,au= application usage,lo= location)Status — participant’s current state (e.g., In study, Left study)
Each subject may appear multiple times if both main and EMA configurations exist for the same participant ID.
Filters above the table allow administrators to search by ID, filter by app type, or filter by sensor usage. This panel is useful for monitoring study progress, reviewing sensor connectivity, and identifying participants who have left the study.
Subject Management Panel
The panel (2) allows administrators to add or remove subjects from the study.
- Subject Information
Displays high-level subject counts:
Total Number of Subjects — planned target number
Number of enrolled subjects — participants currently created in the system
Create Subject The section allows administrators to generate new subject IDs for the study. To add subjects enter the number of new subjects you want to create in the field Number of Subjects and click Create.
Note
The system automatically generates new subject QR codes following the study’s naming convention
(e.g., Demo_Study_00005) which can downloaded from Export PDF toolbar panel.
Remove User
This section allows administrators to remove a subject entry from the study.
To remove a subject, select the subject from the list and confirm the removal.
Important
Removing a subject deletes it from the active study dashboard but does not remove historical data unless server-side deletion procedures are used.
Notification
The notification panel allows administrators to send custom push notifications to selected study participants. This can be used for reminders, announcements, troubleshooting instructions, or follow-up messages.

The panel contains the following fields:
Message title A short title or subject line that appears in the participant’s device notification.
Message text The main body of the notification. This can include instructions, reminders, or any relevant message content.
Recipients list This box displays the subject IDs that will receive the notification. Administrators can manually enter IDs or automatically populate the list using the buttons below.
Two shortcut buttons are provided:
All IDs — fills the list with all enrolled subjects in the study
Missing IDs — fills the list with subjects who have not yet submitted recent data or have missing entries, depending on system configuration
After preparing the message and selecting recipients, click Send notification to deliver the message to the participants’ devices.
Important
Notifications are sent via the JTrack backend and delivered through the device’s native notification system. Delivery times may vary depending on network connectivity and device settings.
Close study
This section allows investigators to formally end a study. Once a study is closed, no new data will be accepted from enrolled participants.

Important
Closing a study does not delete existing data. All sensor and EMA data remain available in the server for export and analysis. However, once a study is closed, it will no longer be visible in the dashboard, and no further data collection will occur.
Edit Study
The Edit Study page allows investigators to modify an existing study’s configuration, update sensor settings, change the assigned EMA survey, or adjust task settings. This interface is identical to the New Study form, but the fields are pre-filled with the study’s current values.
The following elements can be updated directly:
Number of subjects To add more participants check Create Subject section
Duration
Recording frequency
Study description
Passive sensors and active sensors (multi-select lists)
EMA settings (change the survey from list of surveys created, images ZIP upload)
Task list (add, modify, or remove tasks)
All changes are immediately applied once you save the study.
Note
The study name is fixed once the study is created and cannot be changed. It serves as the unique identifier for the study.
Audit / Quality Control
The Test checklist provides a structured way for investigators and research teams to verify that a study is functioning as intended before and during deployment. Each row represents a predefined test case that can be checked directly within the dashboard.
This tool helps ensure data integrity, validate sensor activity, and confirm that participant workflows behave correctly.
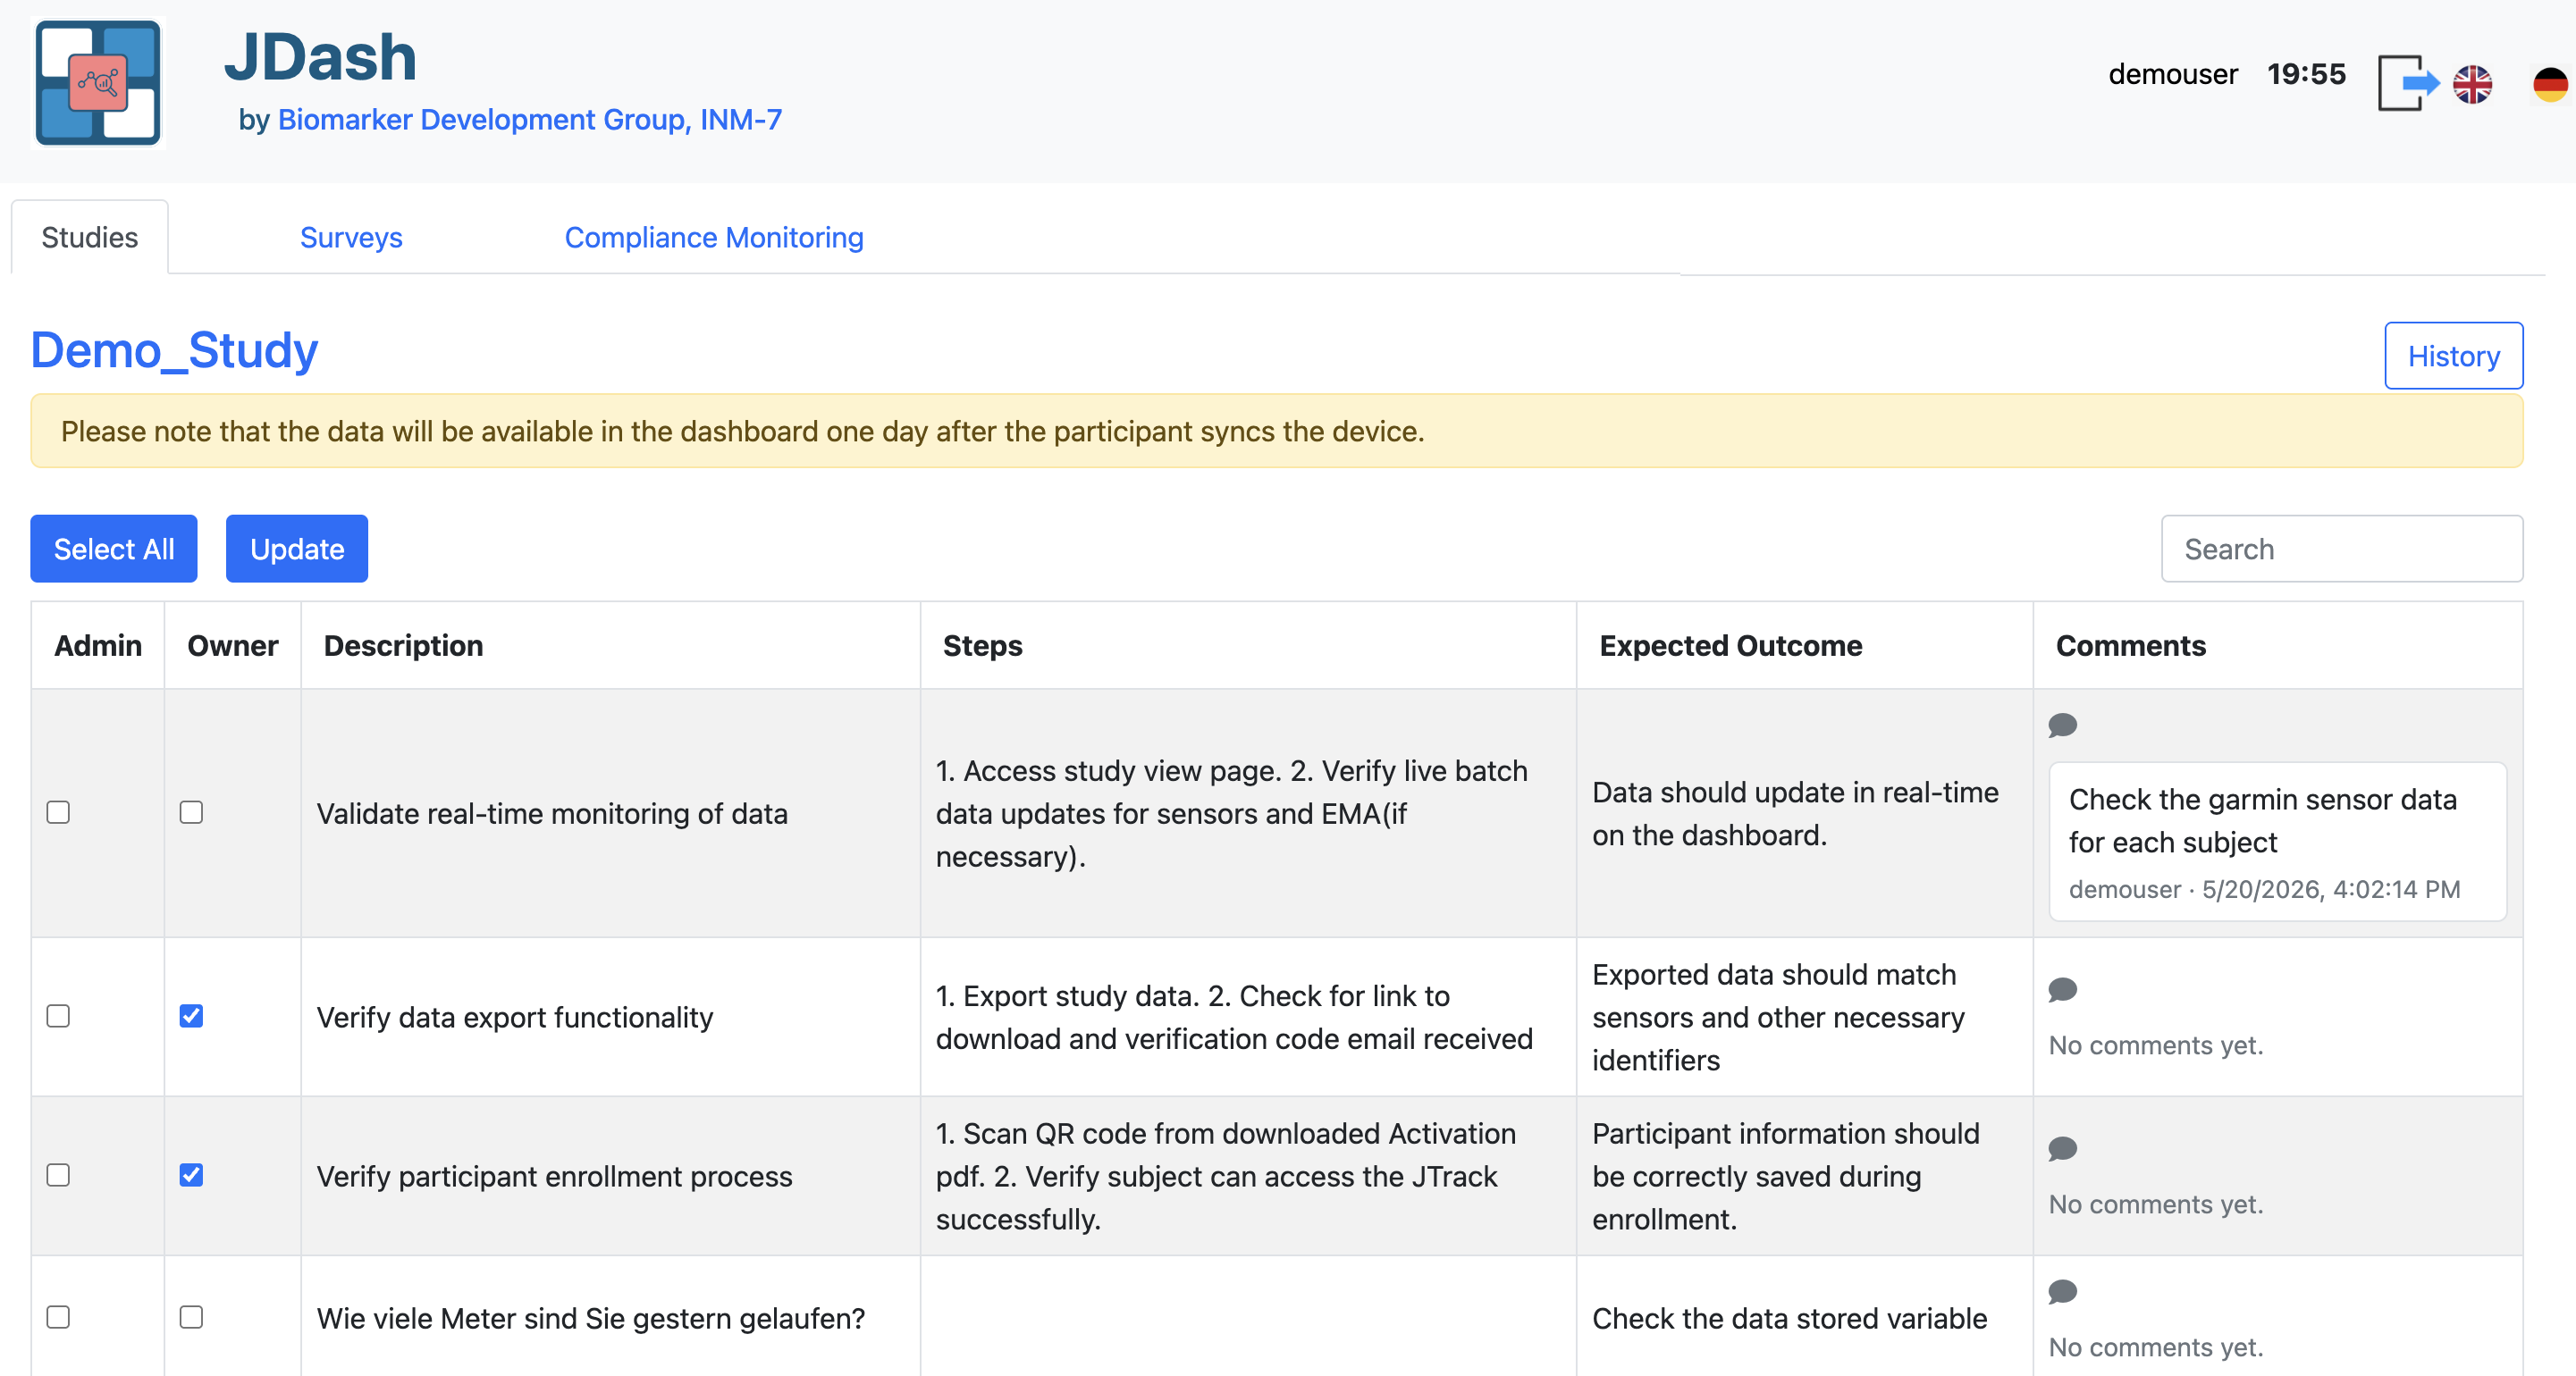
The checklist displays the following information for each test case:
Admin Checkbox used by administrators to mark whether the test case is required or has been reviewed at an admin level.
Owner Checkbox indicating responsibility or completion for the test case by the assigned user or study owner.
Description A brief summary of what the test case is verifying (e.g., real-time monitoring, data export, participant enrollment).
Steps A detailed sequence of actions required to perform the test. These may include navigation steps in JDash, using the JTrack app, scanning QR codes, or validating exported results.
Expected Outcome Describes what should occur if the test is successful. This provides a reference for determining whether the system is behaving correctly.
Comments
Comments allows users to add notes for each test case. Comments can be used to document observations, issues, or follow-up actions during the test and audit process. When a comment is submitted:
The comment is saved with the related test case.
The username and timestamp are recorded.
An email notification is sent to the administrator.
This allows the study team to track audit feedback directly from the dashboard and ensures that important issues are communicated to the admin promptly.
Note
Test case results do not affect participant data collection. The checklist is an internal quality-assurance tool used only for validation and study monitoring purposes.
Survey
Manages EMA (Ecological Momentary Assessment) questionnaires linked to studies. Displays existing surveys with title, study association, creation date, and actions (edit, copy, delete). Upload Section: Allows importing survey definitions via JSON files.
Interface Overview:
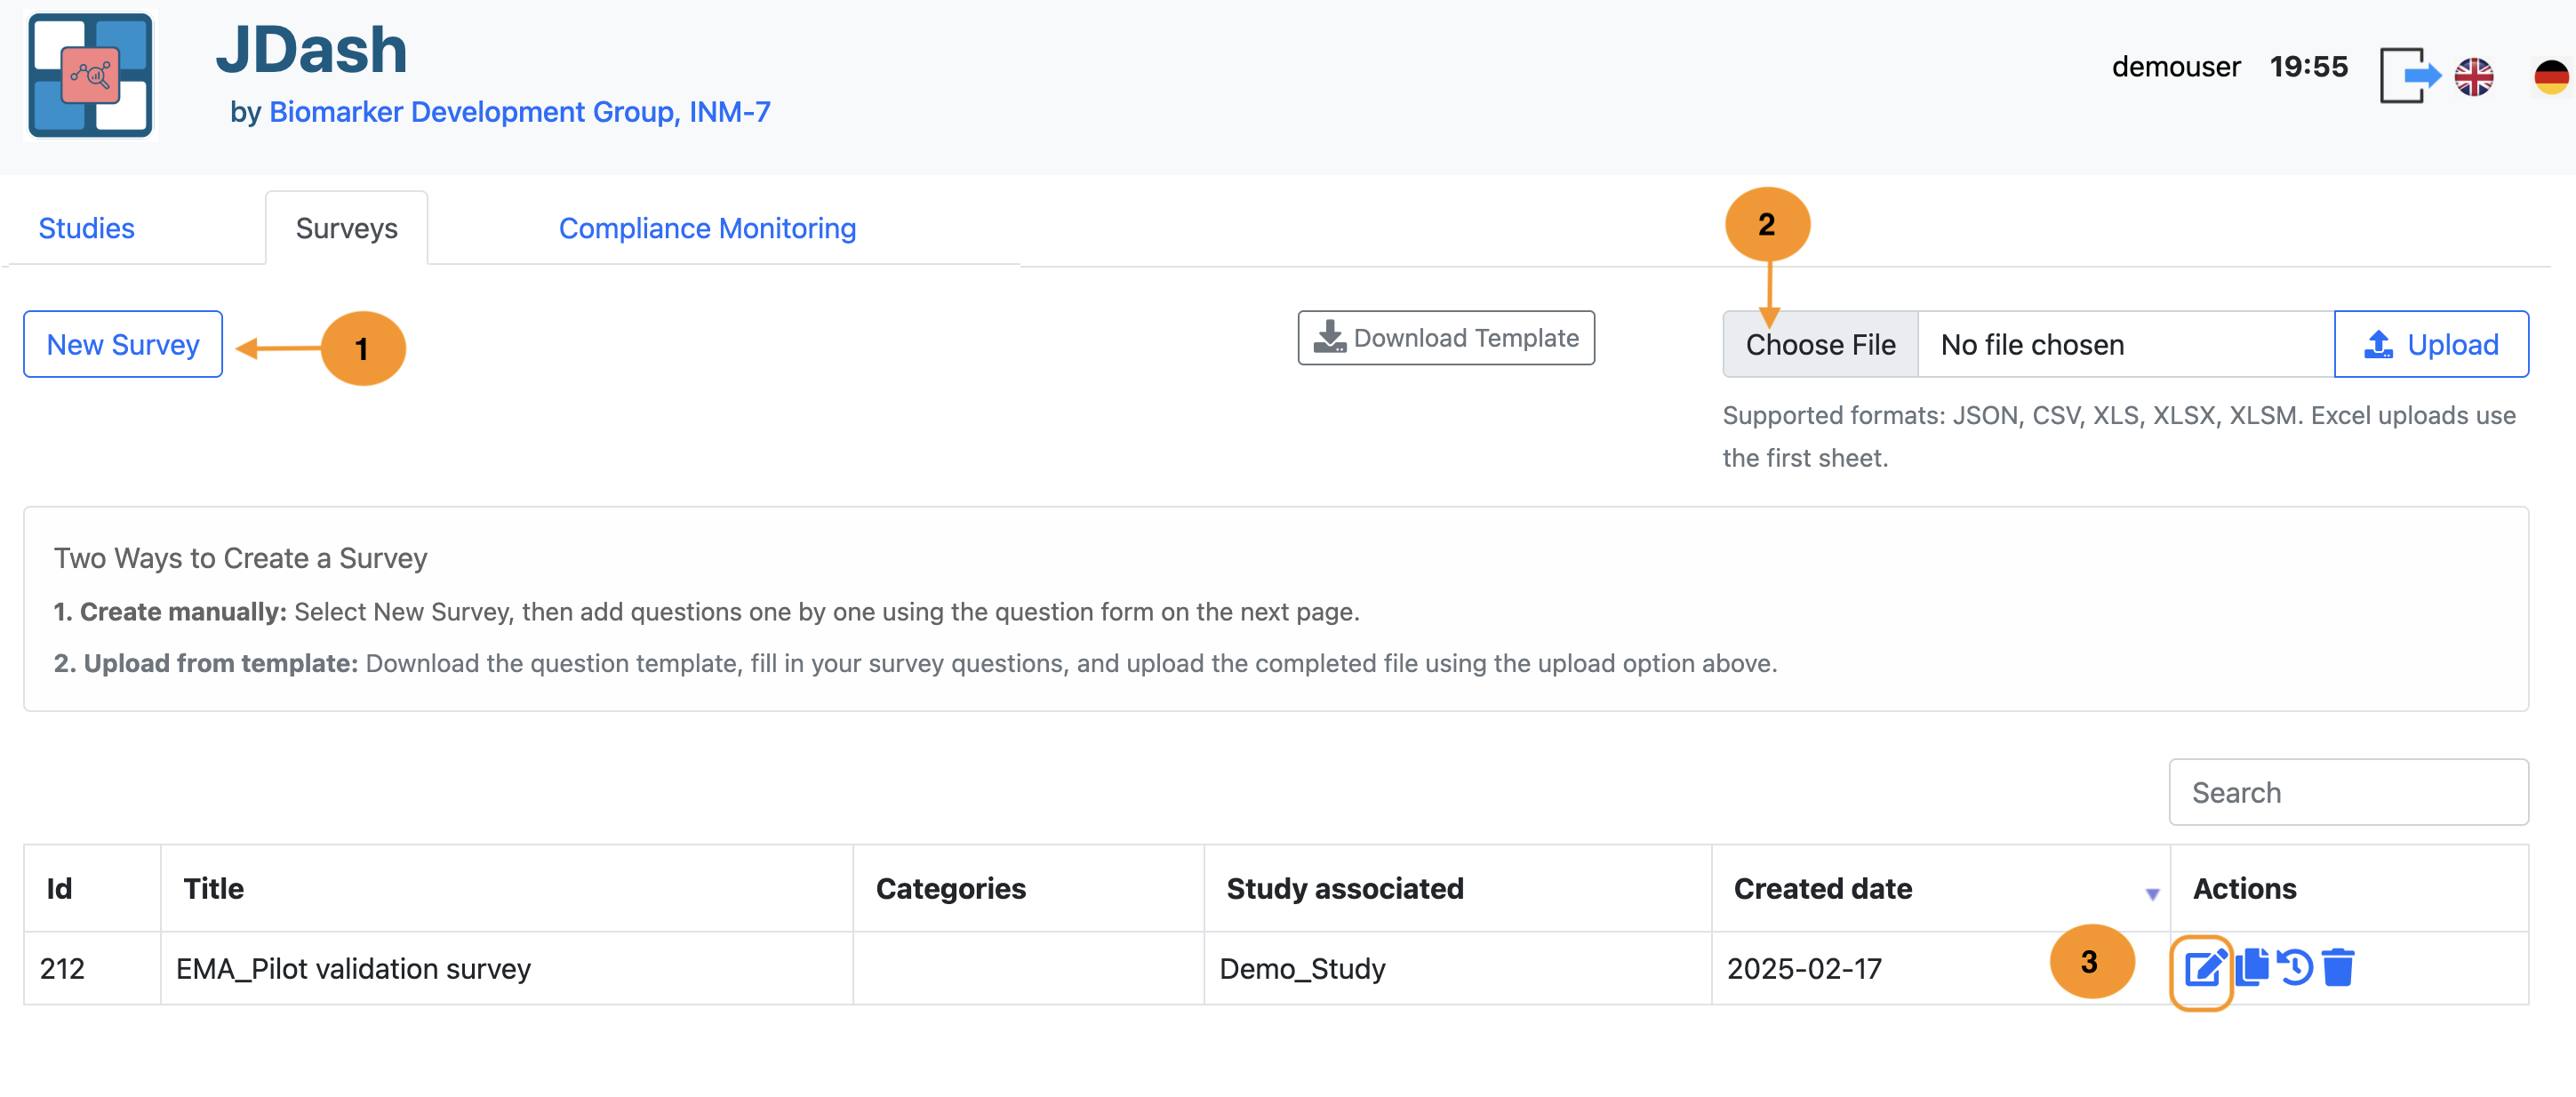
Create Survey
The Survey module allows administrators to define and manage EMA (Ecological Momentary Assessment) questionnaires that will be delivered to study participants. Each survey contains a title, description, scrolling behaviour, and associated question items uploaded later as a JSON file.
The New Survey dialog provides a guided form for creating a survey entry in the system.
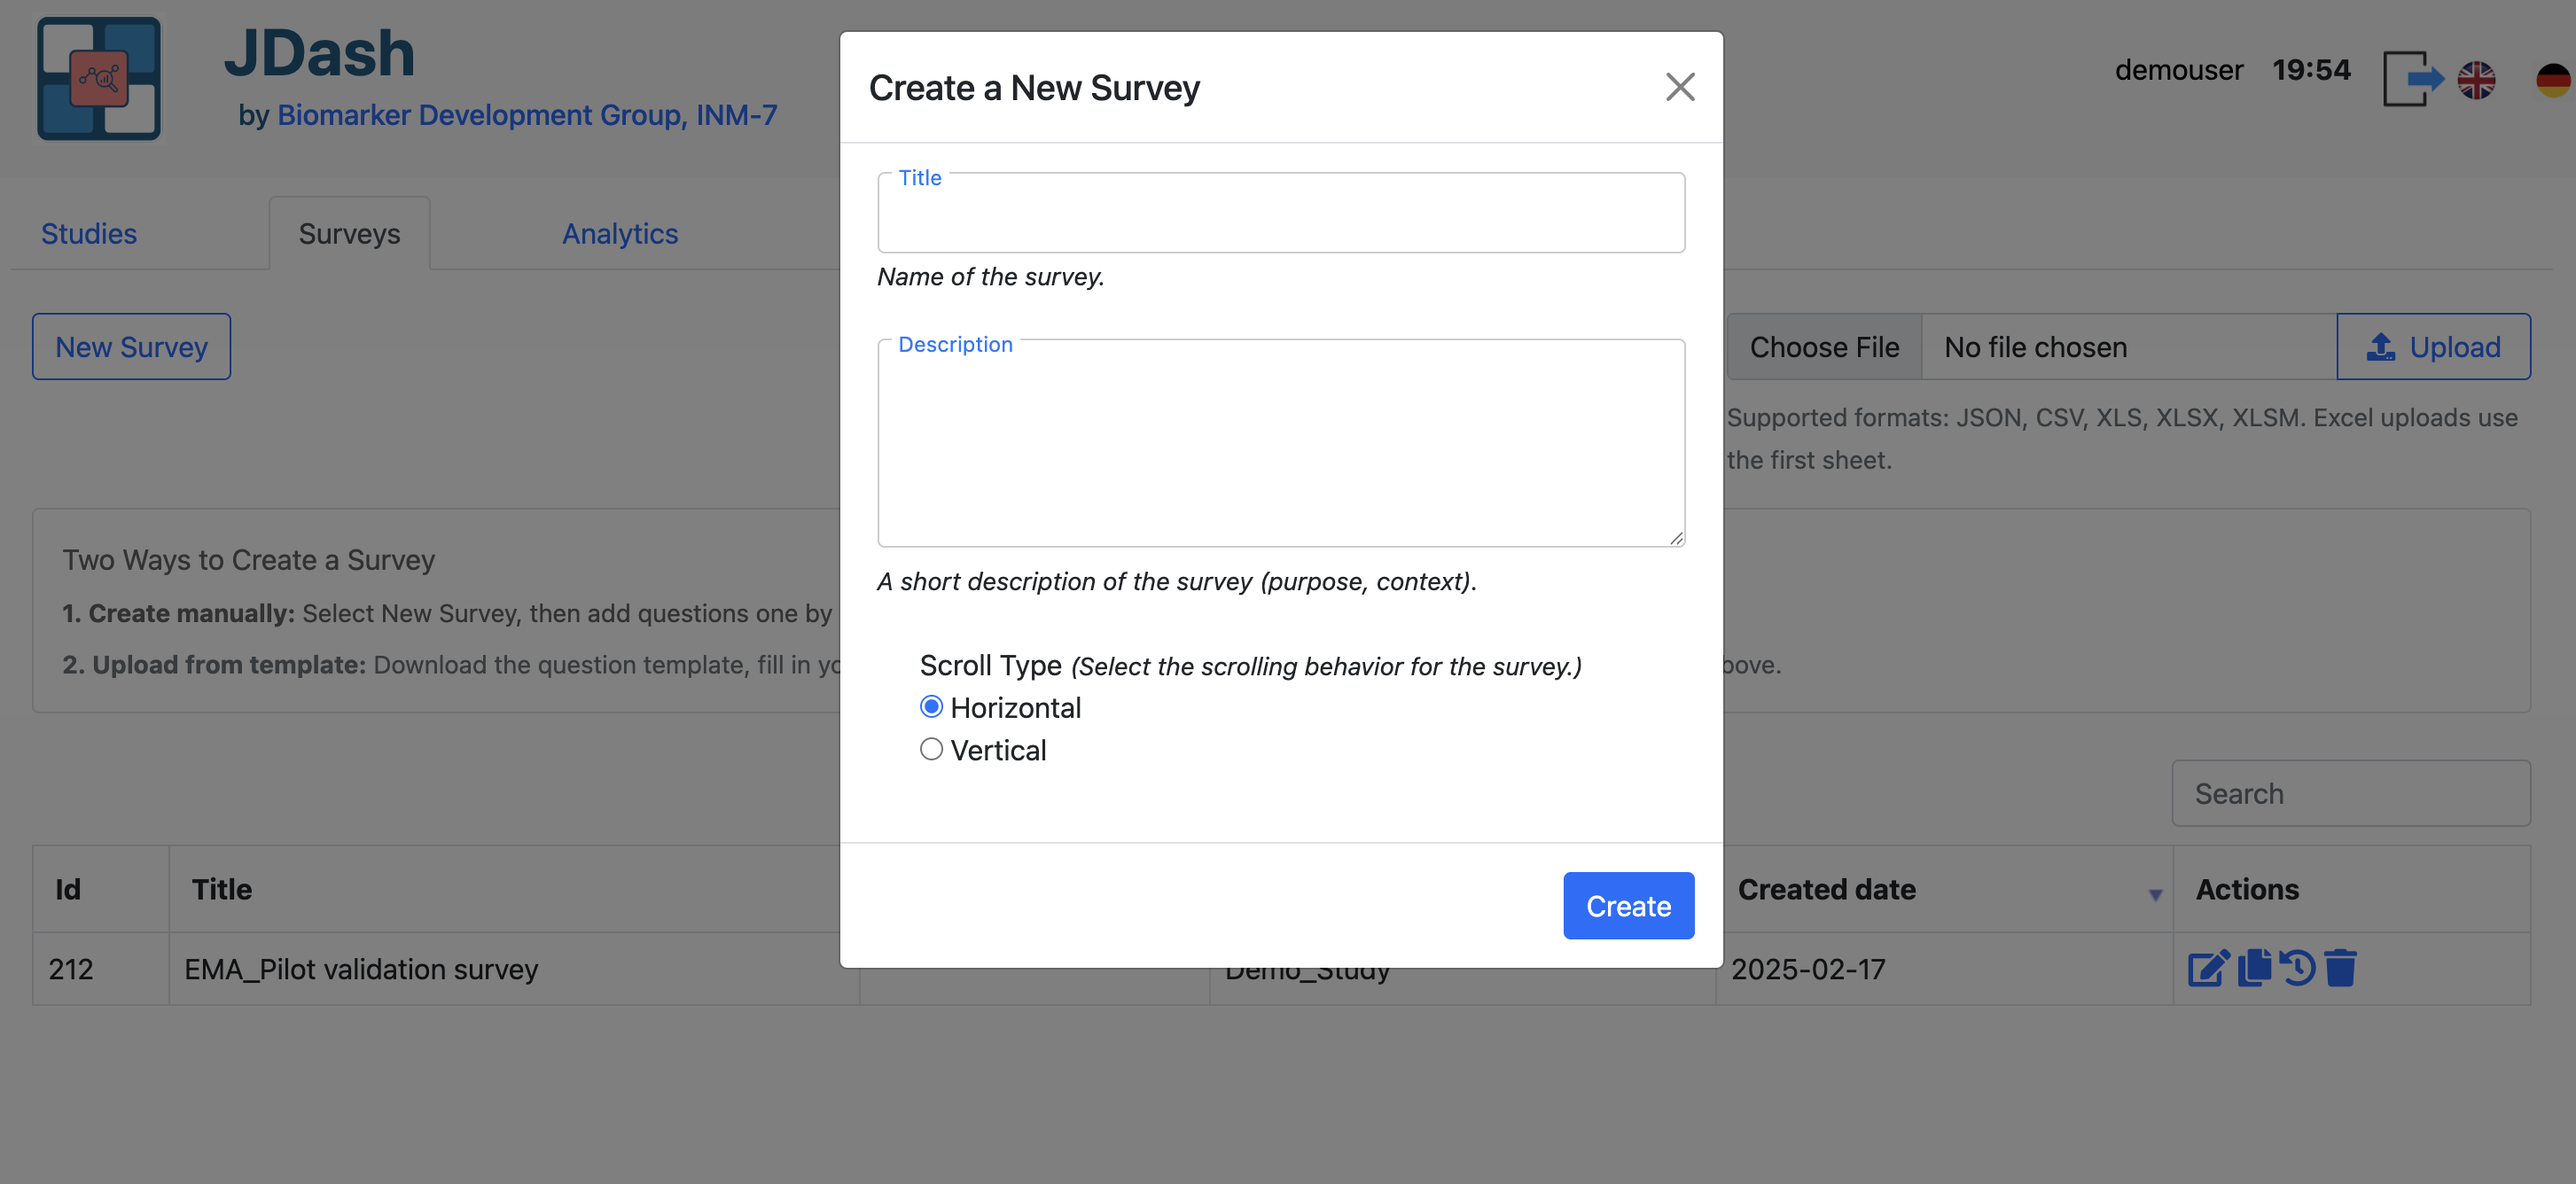
Form Fields
- Title
The display name of the survey. This name appears in the survey list and throughout the dashboard.
- Description
A short explanation of the survey’s purpose, context, or intended use. This helps administrators distinguish between multiple surveys.
- Scroll type
Defines how participants will navigate through the survey items within the JTrack EMA app. Two options are available:
Horizontal – Questions scroll left/right. Suitable for one-question-per-screen layouts, swipe-based navigation, and compact mobile interfaces.
Vertical – Questions scroll top/bottom. Suitable for longer pages, forms with multiple inputs, or free-text responses requiring more space.
Select the option that best matches the design of your survey JSON file.
Upload Survey via JSON
Instead of creating a survey manually through the dialog, you can create a new survey by uploading a JSON definition file. The JSON file must follow the JDash/JTrack EMA survey schema.
The JSON must:
Be valid UTF-8 encoded JSON.
Follow the JDash survey schema (field names and structure).
Define at least the survey metadata and a list of items/questions.
Sample JSON format
A sample format file is provided (for example: sample_survey.json).
Use this as a template when creating new surveys:
{
  "title": "EMA Pilot validation survey",
  "description": "Short description of the survey purpose and context.",
  "scroll_type": "H",   // or "V"
  "topN": -1
  "questions": [
    {
      "id": "1",
      "active": 1,
      "title": "How are you feeling right now?",
      "subText": "How did you sleep last night?",
      "frequency": 1,
      "clockTime": 0,
      "clockTime_start": "480",
      "clockTime_end": "1430",
      "nextDayToAnswer": 0,
      "category": 1,
      "imageURL": "",
      "url": "",
      "questionType": 3,
      "deactivateOnAnswer": "",
      "deactivateOnDate": 0,
      "activate_question": "",
      "deActivate_question": "",
      "activation_condition": "",
      "deActivation_condition": "",
      "answer": [
             {
                 "id": 1,
                 "text": "",
                 "subText": "",
                 "value": 0.1,
                 "defaultValue": 5.0,
                 "stepSize": 1.0,
                 "minVal": 0.0,
                 "maxVal": 10.0,
                 "minText": "Schlecht | Bad",
                 "maxText": "Gut | Good"
             }
         ]
    }
    // additional items ...
  ]
}
When preparing a new survey, copy the provided sample JSON file and adapt:
titleanddescriptionto your study.scroll_typeto match the intended navigation style.The
questionslist to include all questions, response options, and any additional fields required by the schema.
Important
Only JSON files following this structure will be accepted and correctly rendered by the JTrack EMA app.
Survey Details View
After creating or uploading a survey, selecting it from the Survey list opens the Survey Details page. This page displays all questions defined for the survey and provides tools for managing categories, adding new questions, and exporting the survey as JSON.
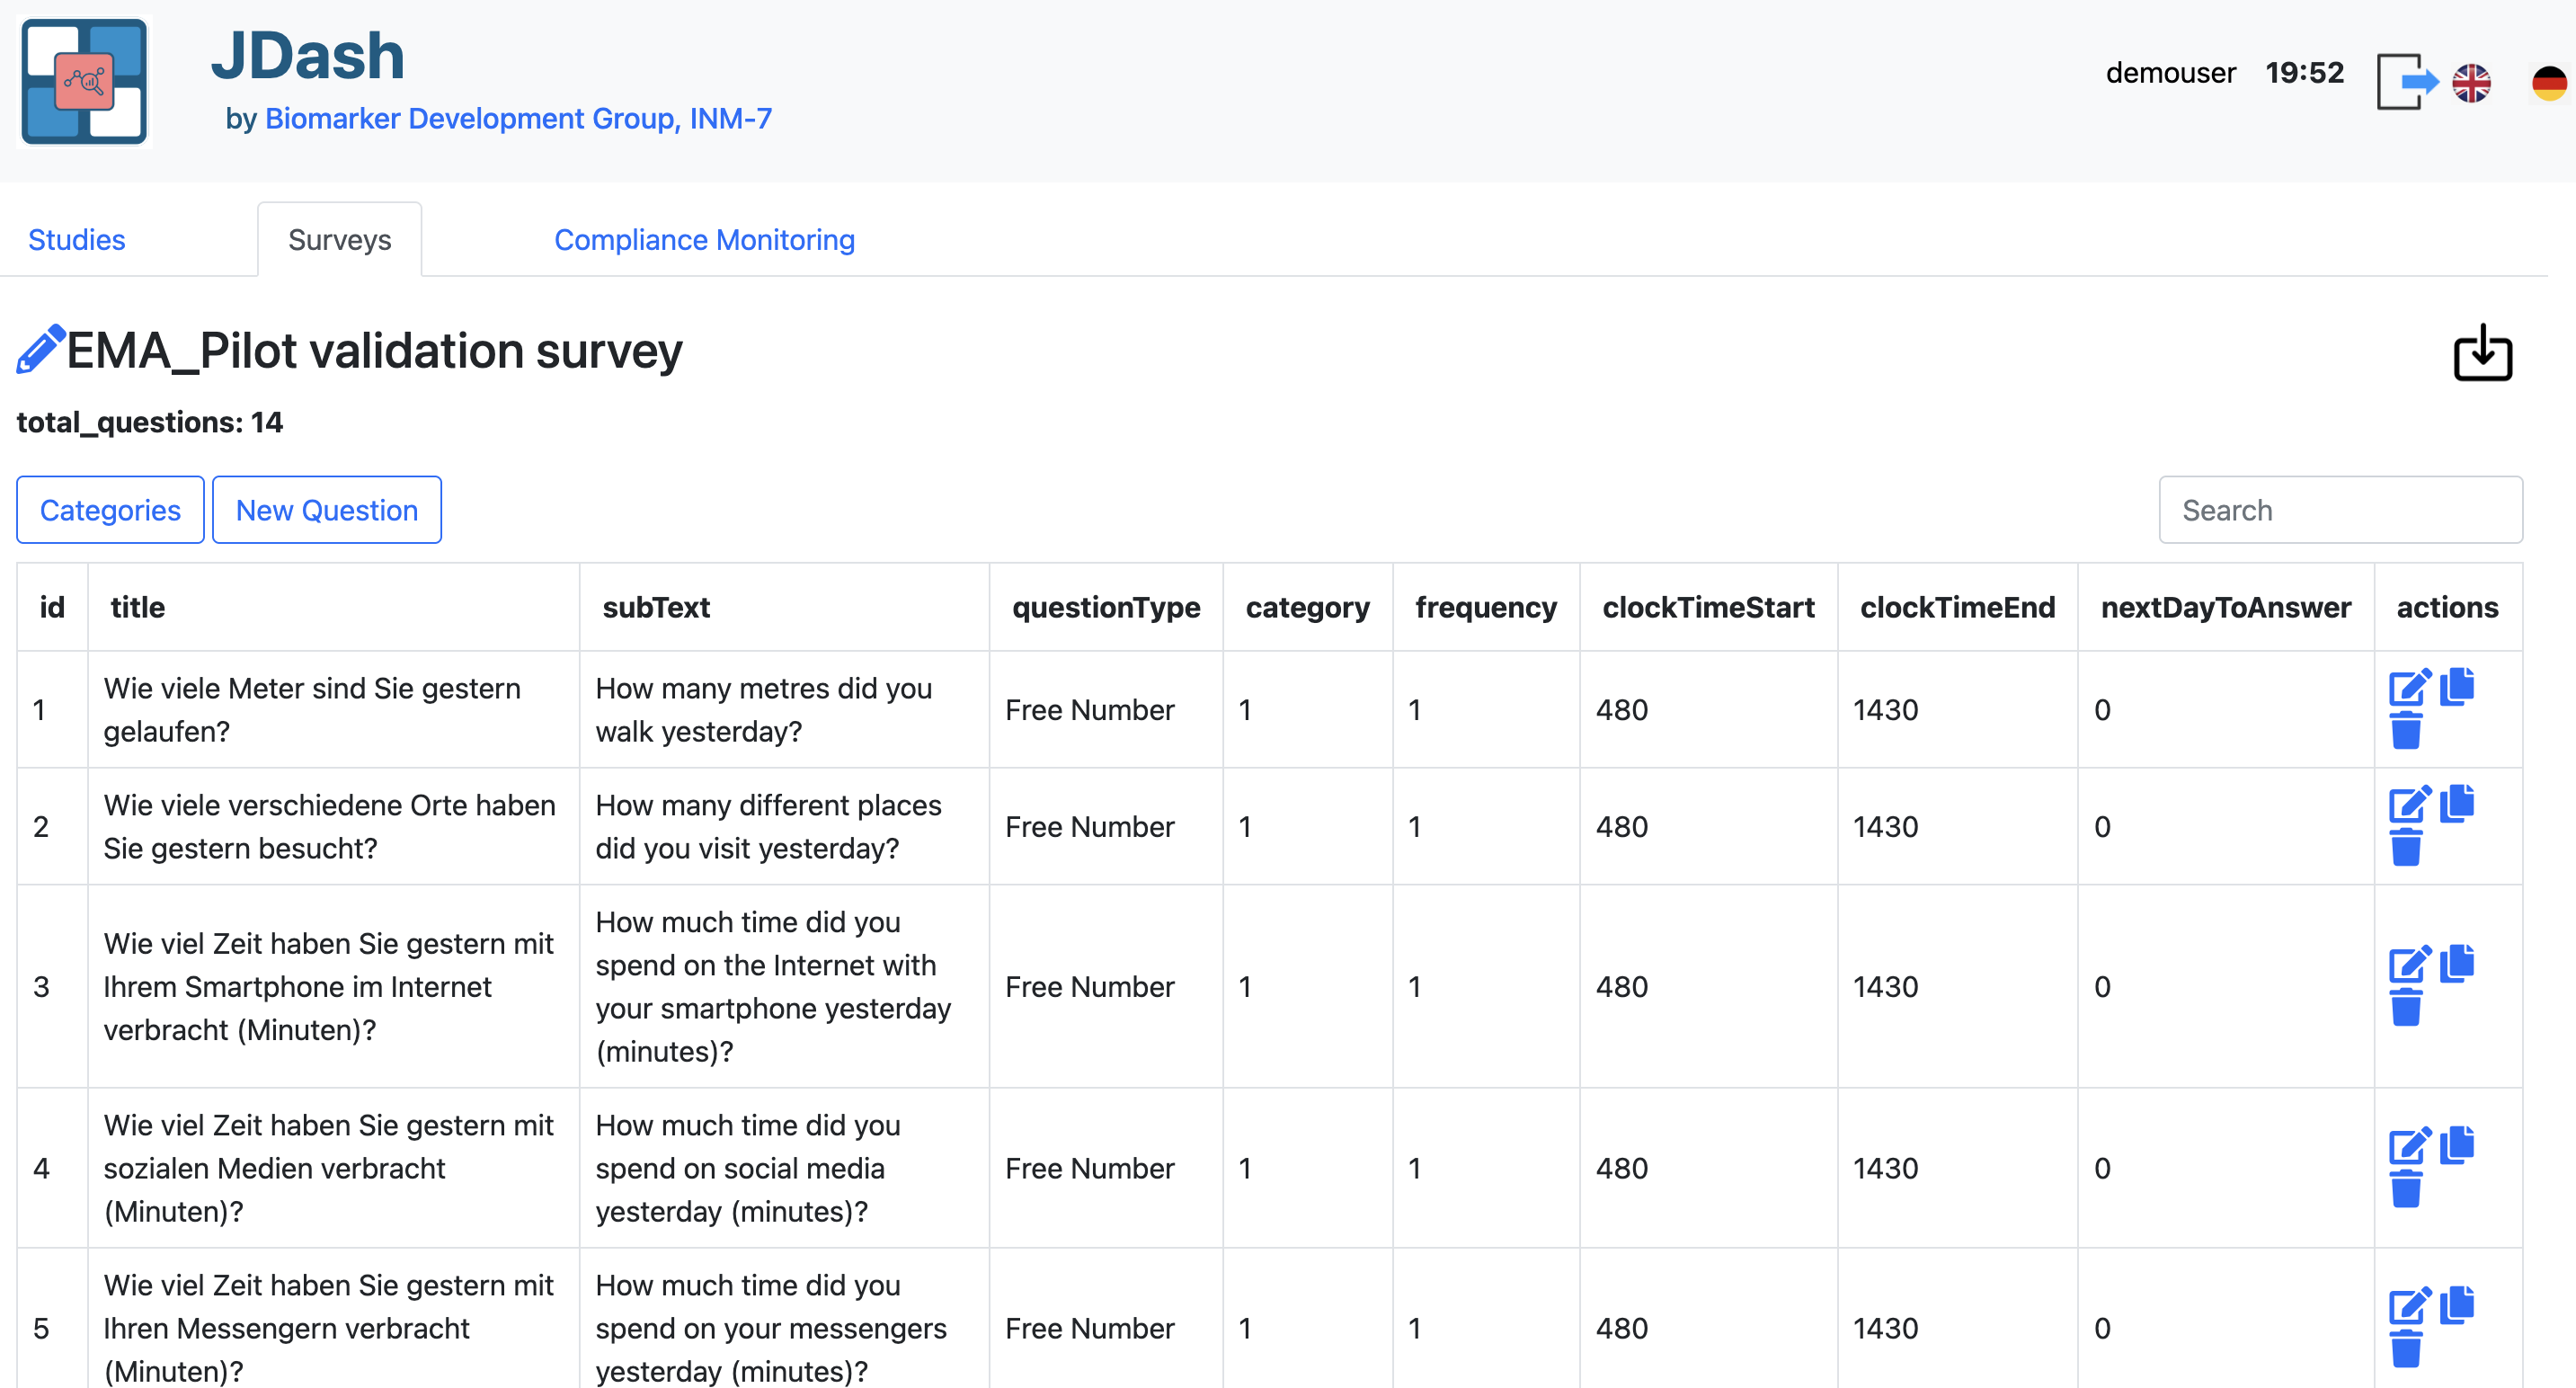
Overview of the Question List
The table shows all survey questions in a structured format. Each row represents a single question and includes:
id — The internal question identifier (order in the survey).
title — The primary question text (German example shown).
subText — The secondary text .
questionType — Input type (e.g., Free Number, Single Choice, Multiple Choice).
category — Category assigned to the question (e.g., IHG, GH).
frequency — How often the question is shown in days.
clockTimeStart / clockTimeEnd — Valid times to receive reminder notification to answer the question.
nextDayToAnswer — day when the questions becomes available to answer.
This view allows users to quickly review the full content of the survey and to edit or organize items as needed.
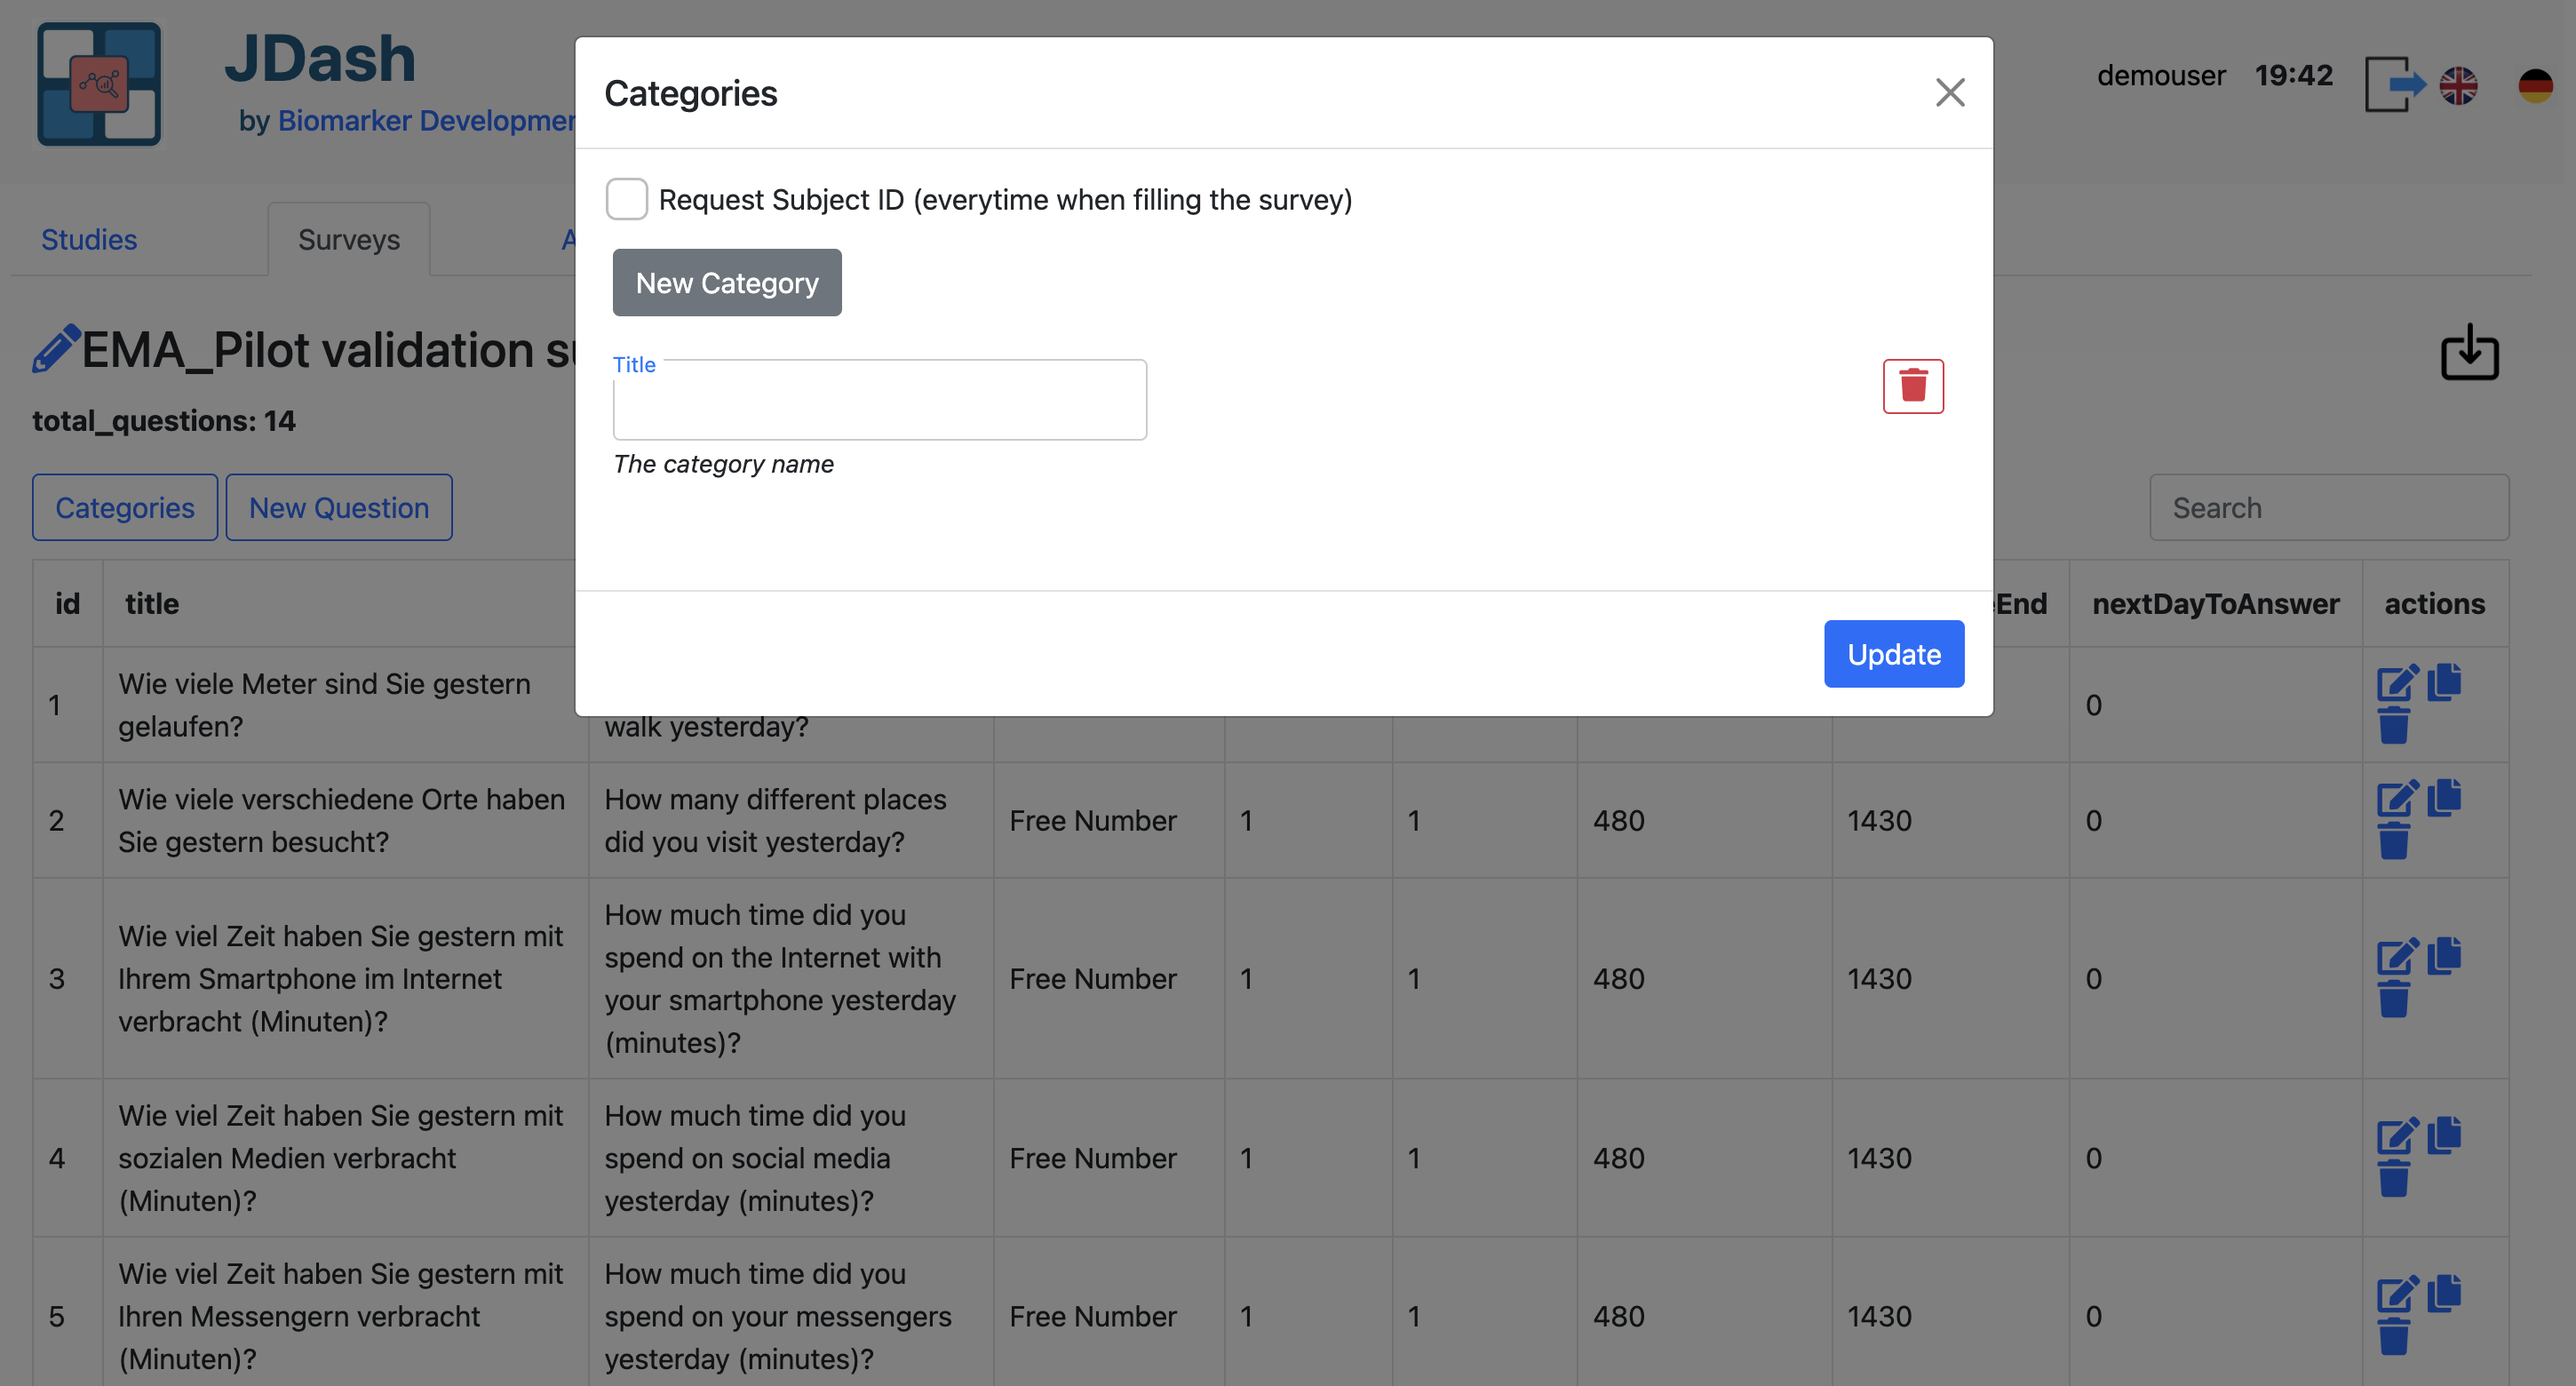
Categories Management
The Categories button opens the category management dialog. Categories help group questions into logical sections and are required for surveys with thematic organization (e.g., “Mobility”, “Digital Use”). Investigators can:
Create new categories
Rename existing categories
Delete categories
Adding New Questions
Click New Question to add a new item to the survey. This opens the question editor, where you can define all properties of the question (text, type, category, scheduling rules, etc.).
For a full description of all editable fields, check Create /Edit Question
Once the question is saved:
It appears immediately in the question list
It can be edited, duplicated, or deleted through the action buttons on the right
This workflow ensures that new survey items follow the same structure and validation rules as existing ones.
Downloading the survey JSON
The download icon (⬇) in the top-right corner of the page exports the entire survey definition as a JSON file. This JSON can be used for:
Backups
Versioning
Editing offline
Sharing surveys between studies
Row Actions (per item)
Each question row includes three action buttons:
- ✏️ Edit
Opens the question editing dialog. Allows modification of text, category, type, time window, and all properties.
- 📄 Copy / Duplicate
Creates a new question using the selected item as a template. Useful when building surveys with repeated or similar formats.
- 🗑️ Delete
Removes the question from the survey. A confirmation prompt prevents accidental deletion.
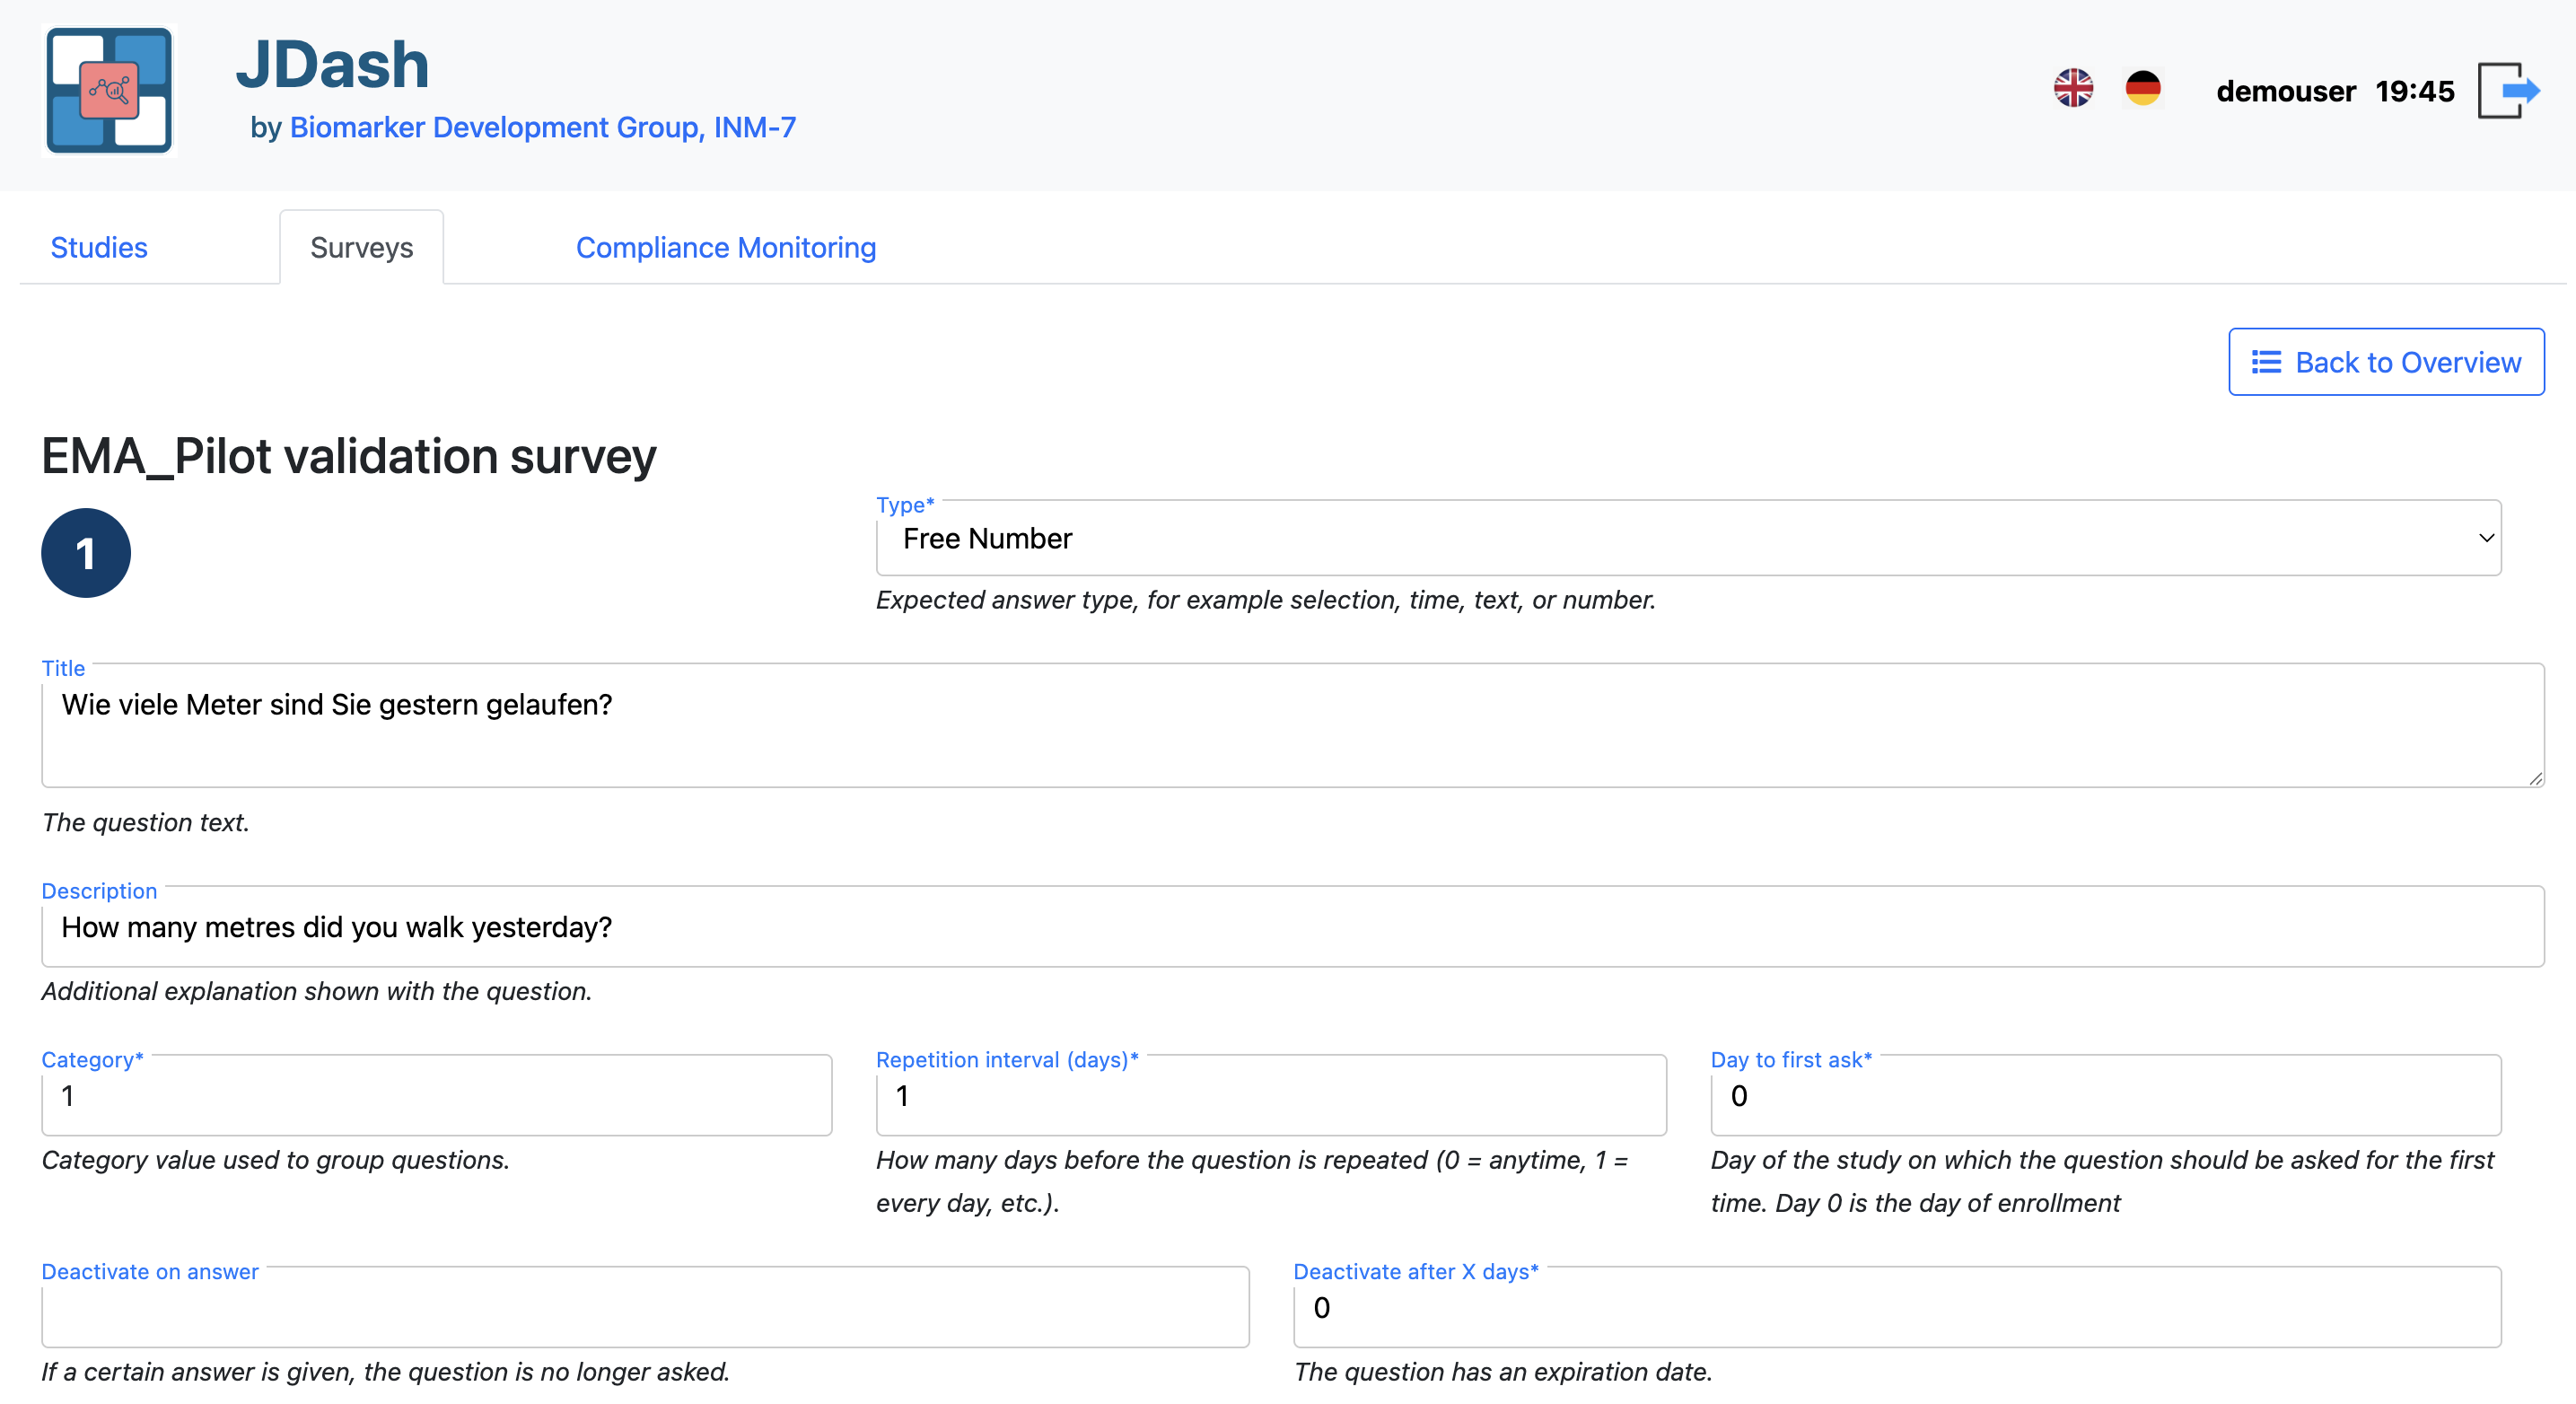
Create / Edit Question
The Question Editor allows investigators to define or modify a single survey question within the EMA survey. Each field controls a specific aspect of how the question behaves, how it appears to the user, and when it is shown.
Form Fields
Below are the descriptions of all fields available in the Create/Edit Question form.
Sequence Id
The position of the question in the survey. Questions are displayed in ascending order based on this value.
Type
Specifies the question type (e.g., Free Number, Single Choice, Multiple Choice, Free Text, Slider). The selected type determines how the question is rendered in the participant application.
Title
The main question text shown to participants (e.g., in German or the primary study language).
Description
Additional descriptive text, explanation, or translation shown below the main question. Useful for bilingual surveys or questions needing clarification.
Use default values toggle
When disabled, all values must be filled manually. If enabled, system-defined default values are used for:
Frequency
NextDayToAnswer
ClockTimeStart
ClockTimeEnd
DeactivateOnDate
Category
A numeric category label used to group questions into thematic clusters.
Example:
1 - Mobility
2 - Digital Activity
3 - Sleep
4 - Mood
Frequency
Defines how often the question is shown.
Values:
0 — Ask at any time the user opens the survey
1 — Ask every day
n — Ask every n days (e.g., 2 = every second day)
NextDayToAnswer
Controls on which study day this question first becomes available.
Examples:
0 — Starts on day 0
1 — Starts on day 1
5 — Question begins appearing on day 5
DeactivateOnAnswer
If set, the question will be skipped or hidden in future survey sessions after a specific answer value is selected. Commonly used to disable follow-up items after a “No” response.
DeactivateOnDate
Defines a study day after which the question should no longer be shown.
Example:
0 — No deactivation by date
10 — Question disappears after day 10 of the study
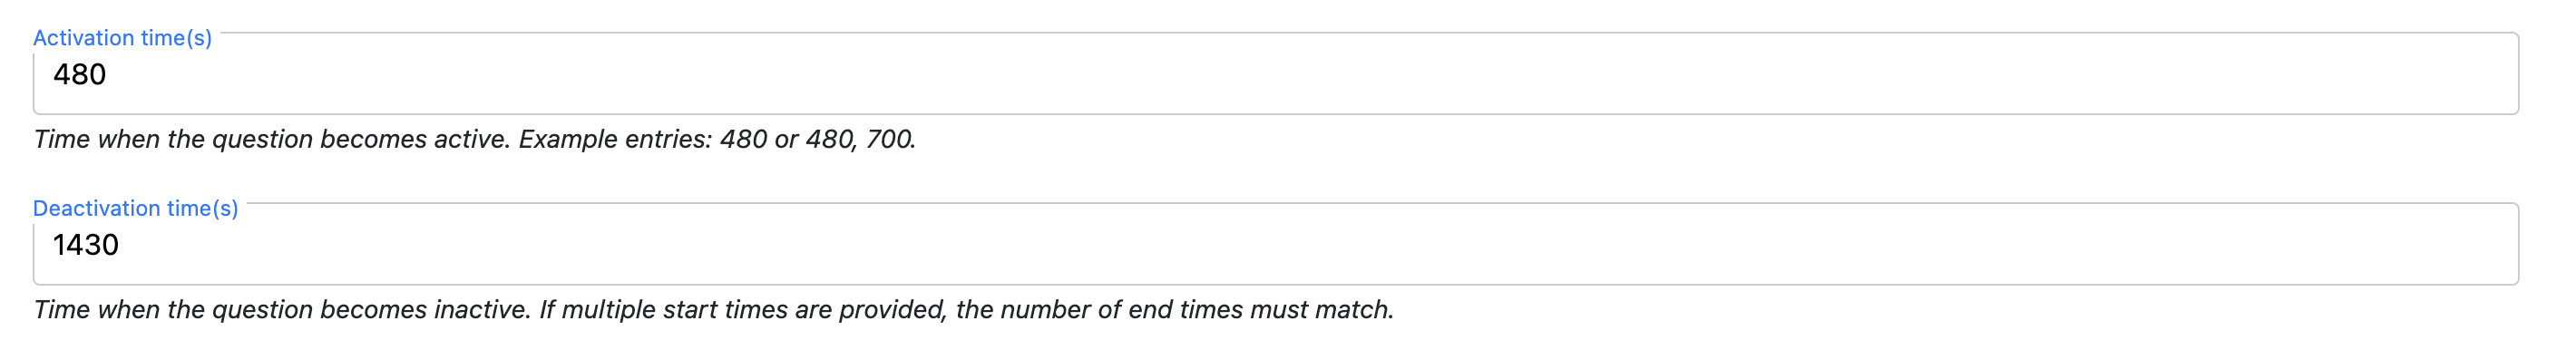
Activation time(s)
The time (in minutes from midnight) when the question becomes active.
Examples:
480 = 08:00
900 = 15:00
If multiple times are provided (comma-separated), the user will receive multiple activations.
These times determine when notifications are sent and when the question appears in the JTrack app.
Deactivation time(s)
The time (in minutes since midnight) when the question becomes inactive.
Must match the number of entries in ClockTime Start if multiple values are used.
Example:
1430 = 23:50
480,900must have a matching600,1000(start/end pairs)
This ensures each activation window has a corresponding end time.
Note
Activation and deactivation times together define the valid response window for each question. Ensure that end times are logically after start times to avoid invalid configurations.
Conditional Logic
You can define conditional logic for a question to dynamically activate or deactivate other questions based on a participant’s response.
Overview
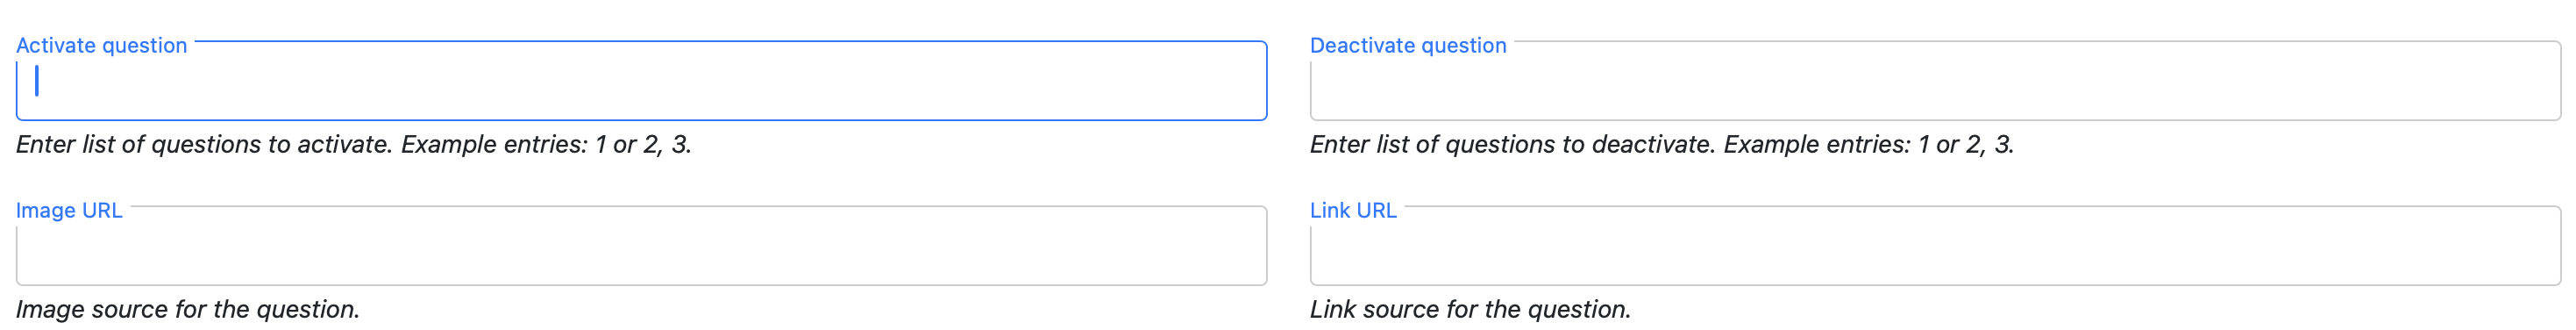
Each question provides the following fields:
Activate Question – Sequence IDs of questions to activate.
Deactivate Question – Sequence IDs of questions to deactivate.
Activation Condition – Displayed when Activate Question is configured.
Deactivation Condition – Displayed when Deactivate Question is configured.
These fields allow you to control which questions appear next, enabling branching logic within a survey.
Activate Question
A comma-separated list of question Sequence IDs that should be activated when the specified condition is met.
Example
12,3
This is typically used to display follow-up questions that are only relevant for certain answers.
Deactivate Question
A comma-separated list of question Sequence IDs that should be deactivated when the specified condition is met.
This is useful for skipping irrelevant or mutually exclusive questions.
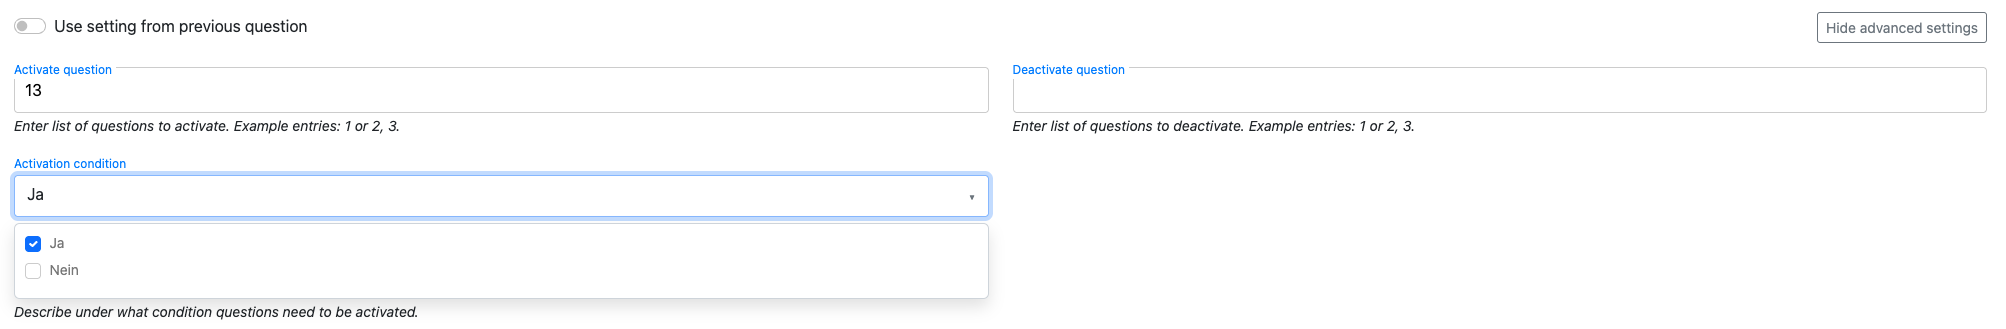
Conditions
The Activation Condition and Deactivation Condition fields determine when the corresponding branching rules are applied.
Activation Condition controls when questions listed in Activate Question become visible.
Deactivation Condition controls when questions listed in Deactivate Question are hidden or skipped.
These fields become available automatically after entering values in the corresponding Activate Question or Deactivate Question fields.
Conditions must match one or more answer choices defined for the current question.
Note
Conditions are evaluated against the participant’s response to the current question. The selected condition value must correspond to one of the configured answer options.
Important
For Single Choice and Multiple Choice questions, activation and deactivation conditions can be selected directly from the available answer choices.
For all other question types, condition values must be entered manually. These values are compared against the participant’s response to determine whether the corresponding activation or deactivation rule is applied.
Combined Logic
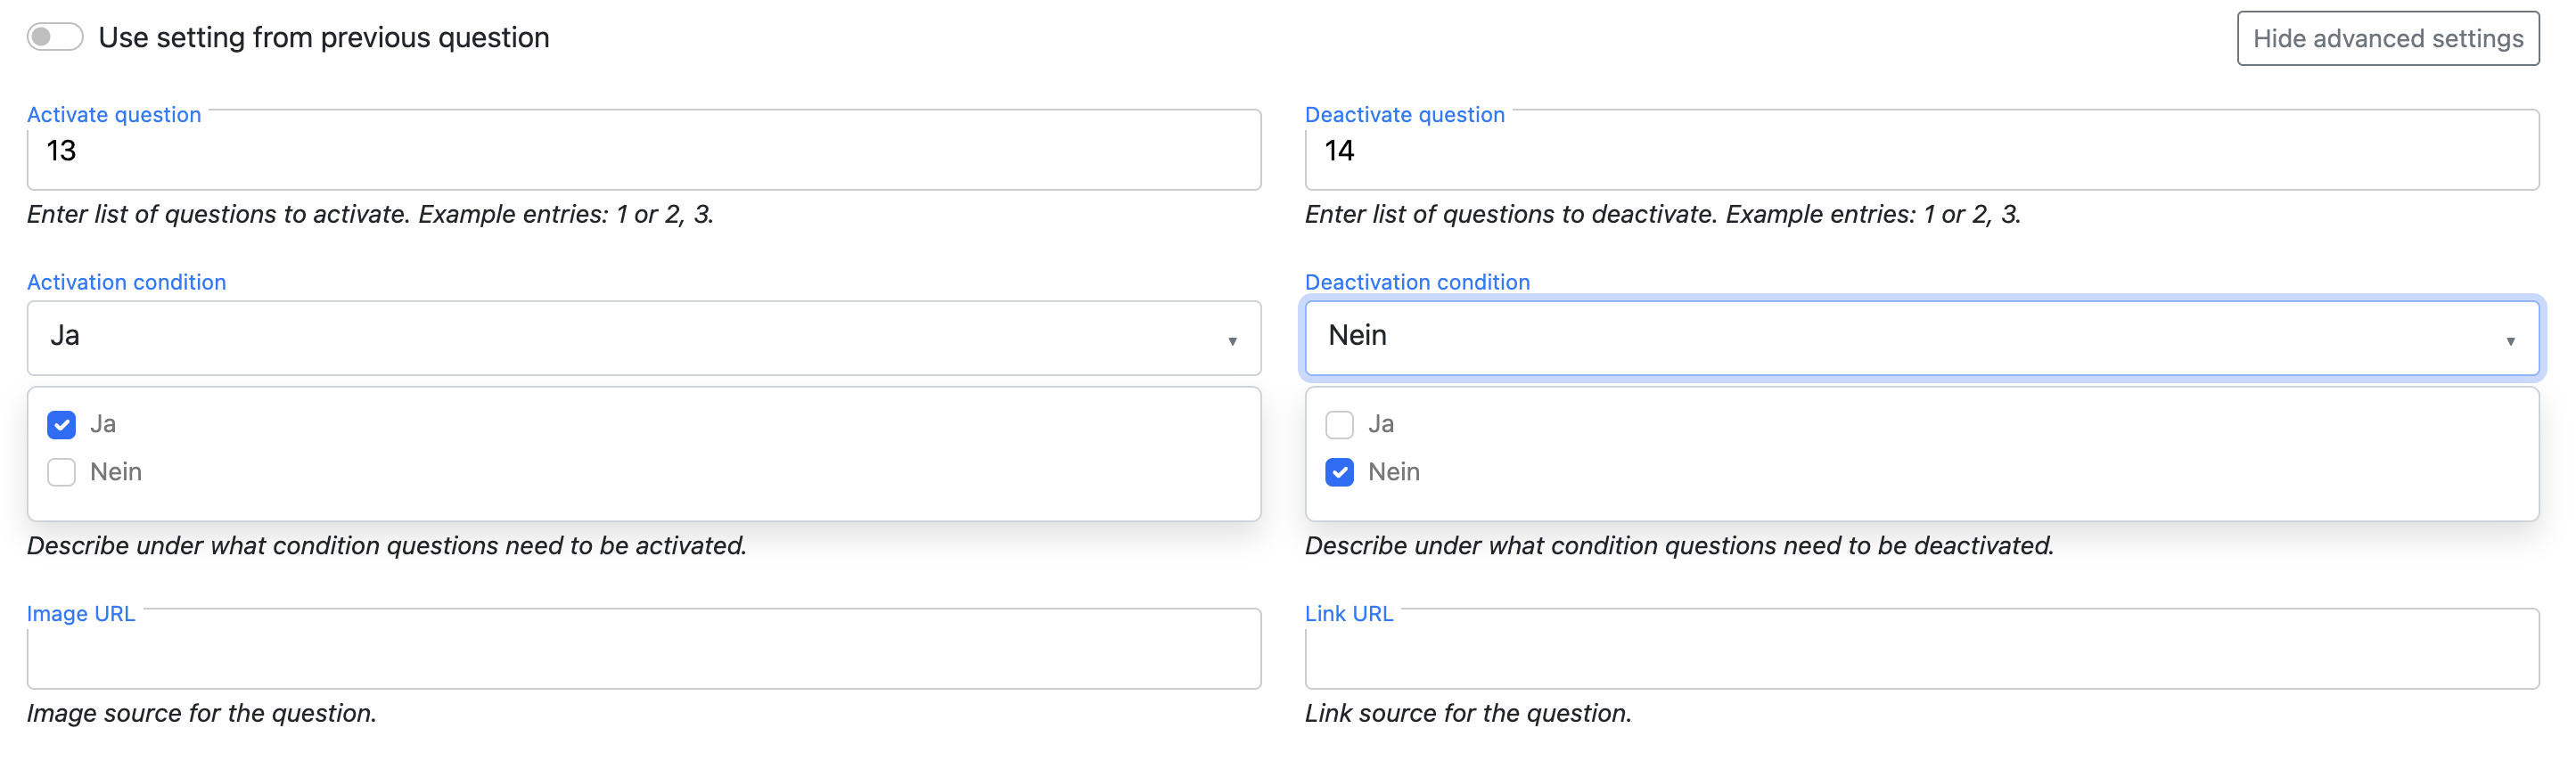
Both activation and deactivation rules can be configured for the same question.
In the example above:
Question
13is activated when the participant selectsJa.Question
14is deactivated when the participant selectsNein.
This allows complex survey flows to be created without requiring separate question groups.
Example scenario
Consider the question:
“Do you currently drive to work?”
Available answers:
JaNein
Configuration:
Activate Question:
13Activation Condition:
JaDeactivate Question:
14Deactivation Condition:
Nein
Result:
Selecting
Jaactivates question13.Selecting
Neindeactivates question14.
Tip
Use activation and deactivation logic to build conditional survey paths, reduce unnecessary questions, and improve the participant experience.
Image URL
An optional image filename associated with the question (e.g., image1.png).
This image must exist in the app’s configured image directory.
URL
An optional external link related to the question (e.g., informational page, instructions, consent wording). The link appears below the question text in the app.
Create / Edit Answer
For question types that require predefined answer options (such as Single Choice, Multiple Choice), the Question Editor displays an Answer Form section. This section allows the investigators to define the selectable choices shown to participants.
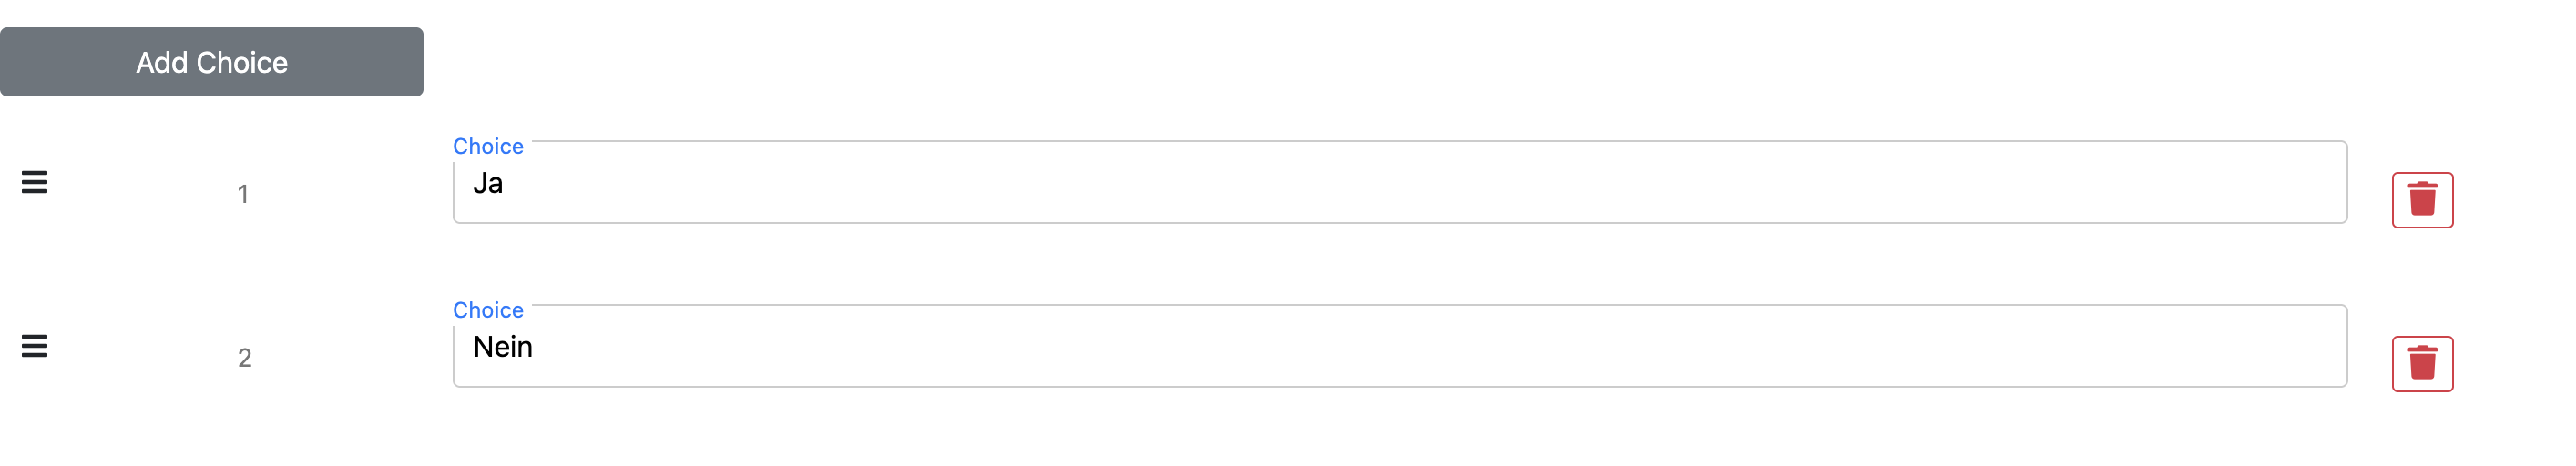
Click Add Choice to insert a new answer option row. Each row contains two fields:
- Sequence Id
The display order of the option. Choices appear in ascending order based on this value.
- Choice
The text label shown to the participant (e.g., Yes, No, Often, Rarely, etc.).
Example:
1 → Less than 10 minutes2 → 10–30 minutes3 → More than 30 minutes
Deleting a choice
To remove an answer option, click the trash icon (🗑️) on the right side of the row. The option is removed immediately from the form.
Compliance Monitoring
The Compliance Monitoring tab provides interactive visualizations for monitoring sensor data collection throughout a study. It helps researchers identify missing recordings, inactive participants, irregular sensor activity, and overall data completeness.
The dashboard focuses on subject-level monitoring and allows users to explore recording patterns across study days using an interactive heatmap.
Selection Panel
The left-side control panel allows users to configure the displayed visualization.
Choose Study
Select the study for which compliance information should be displayed.
Select Sensor
Choose the sensor type to visualize (e.g., activity, location, accelerometer, application usage).
Choose X-axis
Select how data should be displayed along the horizontal axis. Available options may include:
Study day
Calendar date
Filter Subjects
Optionally restrict the visualization to specific participants instead of displaying the entire study cohort.
Visualization Panel
The main panel displays a heatmap representing sensor activity across participants and study days.
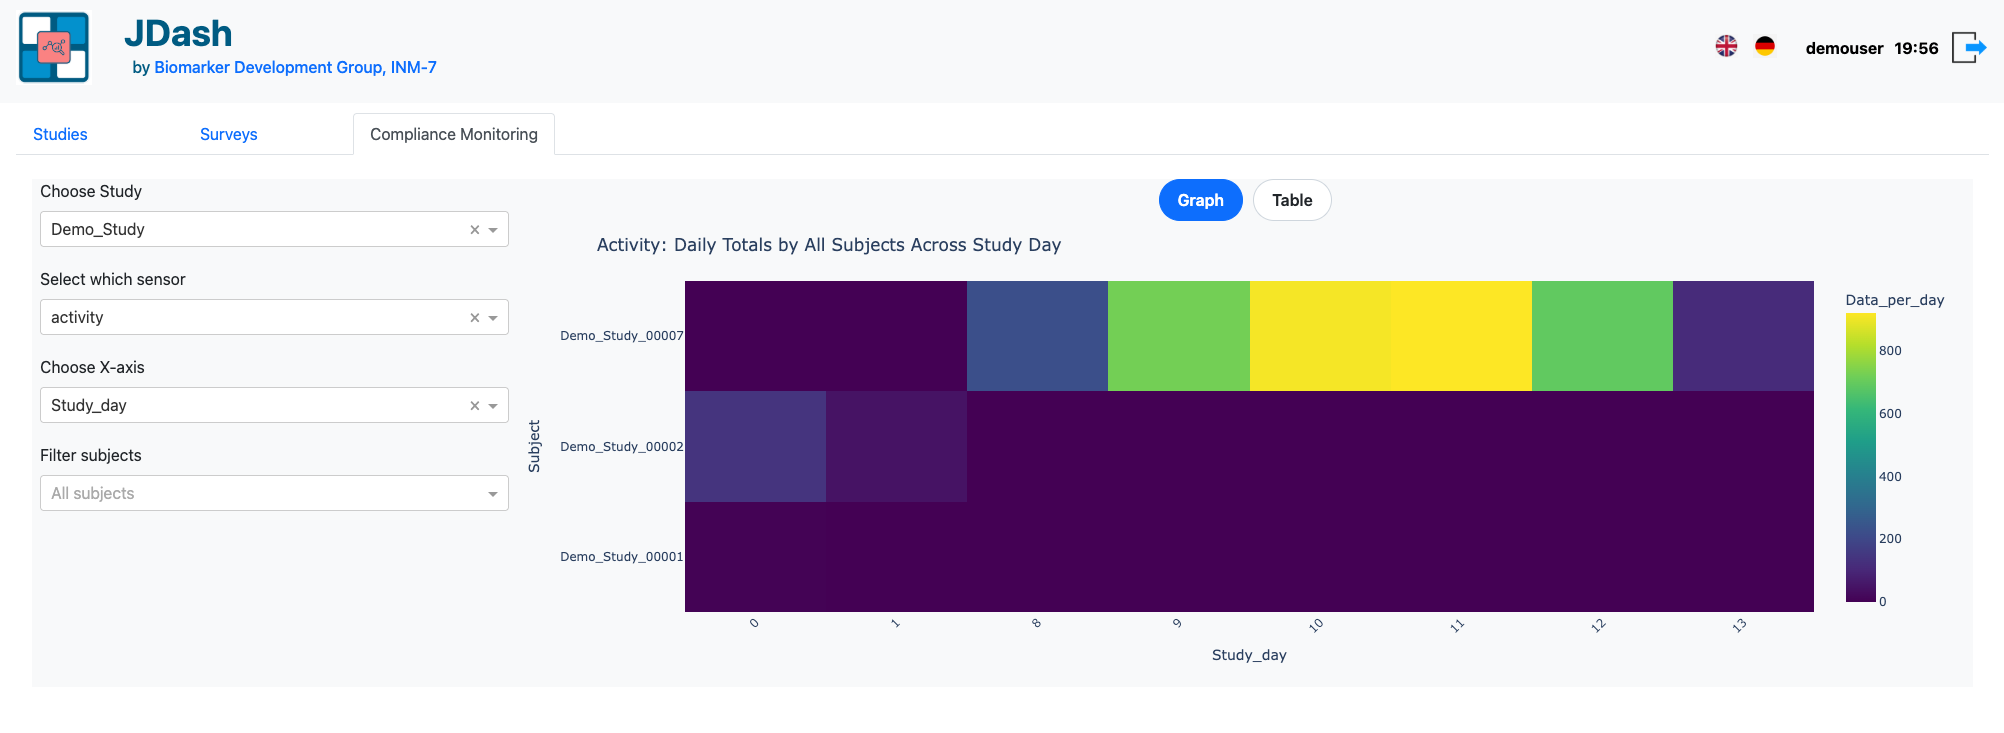
Subject QC Timeline
The Subject QC Timeline heatmap provides an overview of sensor recordings for each participant throughout the study.
Y-axis — Subject IDs
X-axis — Study day or selected time axis
Color intensity — amount of recorded sensor data for the selected sensor
Higher color intensity indicates greater recording activity, while lighter regions may indicate reduced or missing data.
The visualization can help identify:
Missing recordings
Participants with limited sensor activity
Periods of device inactivity
Sensor interruptions
Longitudinal recording patterns
Note
Depending on synchronization schedules and backend processing, uploaded data may appear in the dashboard with a delay after the participant syncs the device.
Notification Scheduler
JDash includes a background notification scheduler that automatically sends EMA reminders to participants based on the survey configuration.
The scheduler runs periodically as a cron job and processes a generated JSON schedule containing:
Study days on which notifications should be sent
Activation times configured for survey questions
Study-specific notification schedules
Workflow
Survey activation times are configured in the EMA survey definition.
The notification schedule is generated and stored as a JSON structure.
The scheduler runs at regular intervals via cron.
For each participant, the scheduler calculates the current study day based on the enrollment date.
The scheduler checks whether the current study day exists in the generated notification schedule.
If a configured activation time falls within the current processing window, a push notification is sent to the participant’s device.
Notifications are delivered through Firebase Cloud Messaging (FCM).
Generated Schedule
The scheduler uses a generated JSON file that maps study days to activation times.
Example:
{
   "Study_A": {
      "days": {
         "0": [480, 720],
         "1": [480, 720],
         "2": [480]
      }
   }
}
In this example:
Day 0: notifications at 08:00 and 12:00
Day 1: notifications at 08:00 and 12:00
Day 2: notification at 08:00
This ensures that participants receive reminders relative to their individual enrollment date.
Notification Delivery
Notifications are delivered to enrolled participants through the mobile application and are used to inform users that new EMA questions are available.
Note
Notification schedules are derived directly from the EMA survey configuration. Any changes to survey activation times are automatically reflected in future notification schedules after the schedule is regenerated.
Deployment Instructions
JDash can be deployed locally for development or on a production web server
using Apache and mod_wsgi. The latest deployment steps, environment setup, database configuration, and
server configuration details are maintained in the official GitHub repository.
https://github.com/Biomarker-Development-at-INM7/JTrack-dashboard